
The GBP/USD currency pair on Wednesday pulled back off session highs of about 1.2700 to trade at about 1.2540. The currency pair has completed a downward breakout from an ascending channel formation.
The pair has now fallen to trade several levels below the 100-hour moving average line in the 60-minute chart. As a result, the currency pair fell into the oversold levels of the 14-hour RSI.
GBP/USD Fundamentals Overview

From a fundamental perspective, the GBP/USD currency pair is trading at the back of a relatively busy period in the US market. On Wednesday, the US consumer price index for March exceeded the forecasted (MoM) change of 0.3% with a change of 0.4%. The (YoY) equivalent also beat the estimate of 3.4% with a change of 3.5%.
On the other hand, the consumer price index ex-food and energy for the period beat the forecasted (MoM) and (YoY) expectations of 0.3% and 3.7%, respectively with changes of 0.4% and 3.8%. Wholesale sales for February steadied at 0.5% in line with expectations.
Earlier in the week, the NFIB business optimism index for March missed the expectation of 90.2 with a reading of 88.5. RealClearMarkets/TIPP Economic Optimism for April missed the expected (MoM) reading of 44.2 with a reading of 43.2.
In the UK, the BRC Like-for-Like retail sales for March grew by 3.2% compared to a growth rate of 1% in February, beating the forecasted change of 1.8%. Traders will be looking forward to the RICS Housing Price Balance later on Wednesday.
GBP/USD Technical Analysis (the 60-min Chart)

Technically, the GBP/USD currency pair appears to have recently completed a downward breakout from an ascending channel formation. The 14-hour RSI also seems to support a short-term bearish bias after falling into oversold conditions.
Therefore, the bears will be targeting an extended run of declines at about 1.2519 or lower at 1.2496. On the other hand, the bulls will look to pounce on rebounds at about 1.2564 or higher at 1.2585.
GBP/USD Technical Analysis (the Daily Chart)
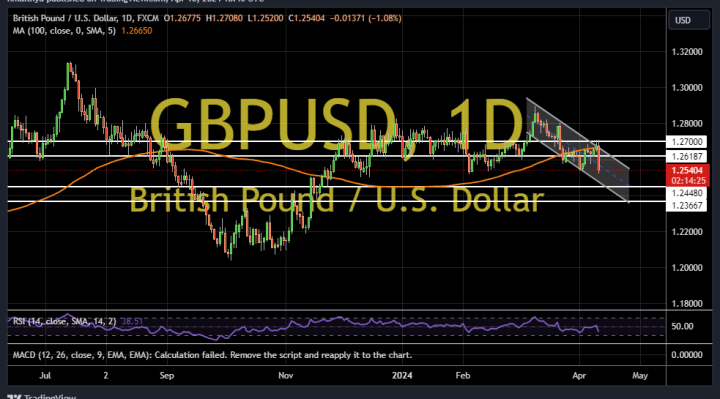
In the daily chart, the GBP/USD currency pair appears to be trading within a descending channel formation. The 14-day RSI also seems to support a bearish bias after pulling back to move closer to oversold conditions.
Therefore, the bears will be targeting long-term profits at about 1.2448 or lower at 1.2366. On the other hand, the bulls will look to pounce on profits at about 1.2618 or higher at 1.2700.