
The GBP/USD currency pair on Thursday pulled back off the session highs of about 1.2634 to trade at about 1.2596. The currency pair appears to have completed a downward breakout from an ascending channel formation.
The pair has now fallen to trade below the 100-hour moving average line in the 600-minute chart. As a result, the currency pair appears to be on the verge of breaking into the oversold levels of the 14-hour RSI.
GBP/USD Fundamentals Overview

From a fundamental perspective, the GBP/USD currency pair is trading at the back of a relatively busy period in both markets. On Thursday, the UK’s RICS housing price balance for January beat the expected change of -25% with a change of -18%.
On Wednesday, Halifax House Prices for the period also beat the forecasted (MoM) change of 0.8% with a change of 1.3%. Earlier in the week, the BRC Like-for-Like retail sales for January outshone the (YoY) forecast of 1.2% with a change of 1.4%. The S&P Global/CIPS Composite PMI beat 52.5 with 52.9, while the Services PMI exceeded 53.8 with 54.3.
In the US, the initial jobless claims for the week ending February 2 beat the expected claim count of 220k with a slightly lower tally of 118k. The continuing claims for the preceding week also outshone 1.878 million with a tally of 1.871 million.
On Wednesday, US consumer credit change for December missed the expectation of $16 billion with a change of $1.56 billion. Earlier in the week, the ISM Services PMI for January outperformed the expected reading of 52 with a reading of 53.4.
GBP/USD Technical Analysis (the 60-min Chart)
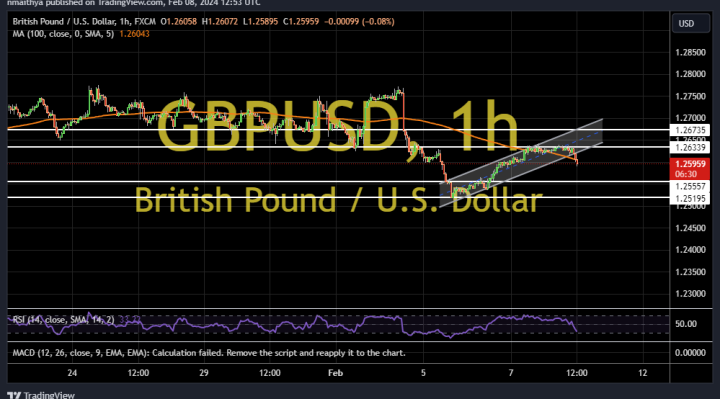
Technically, the GBP/USD currency pair appears to be about to complete a downward breakout from an ascending channel formation. The 14-hour RSI also seems to support a short-term bearish bias as it edges closer to oversold conditions.
Therefore, the bears will be looking to extend the current run of declines toward 1.2555 or lower to 1.2519. On the other hand, the bulls will look to pounce on rebounds at about 1.2634 or higher at 1.2673.
GBP/USD Technical Analysis (the Daily Chart)
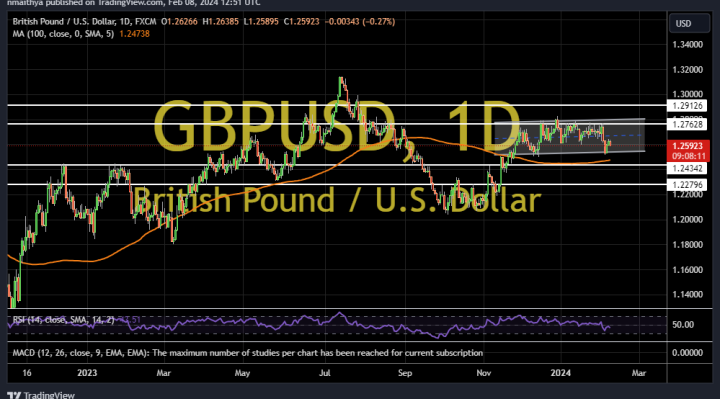
In the daily chart, the GBP/USD currency pair appears to be trading within a sideways channel formation. The 14-day RSI also seems to lack a directional bias as it remains central.
Therefore, the bears will be targeting potential downward movements at about 1.2434 or lower at 1.2279. On the other hand, the bulls will look to pounce on upward profits at about 1.2762 or higher at 1.2912.