
On Friday, the GBP/USD currency pair pulled back from the session highs of about 1.2661 to trade at about 1.2622. The currency pair trades within a descending channel formation in the 60-minute chart.
The pair has now fallen to trade several levels below the 100-hour moving average line. As a result, the currency pair is on the verge of entering the oversold levels of the 14-hour RSI.
GBP/USD Fundamentals Overview

From a fundamental perspective, the GBP/USD currency pair trades during a relatively busy period in both markets. On Friday, the U.K. Gfk consumer confidence for December improved slightly to -17, up from -18 in November, beating the forecast of -18. On the other hand, the UK gross domestic product for October missed the expectation of 0.1% with a change of -0.1% (MoM). The industrial production for the months also fell short of 0.3% with a change of -0.6% (MoM), while the Manufacturing Production missed 0.2% with a change of -0.6% (MoM).
In the U.S., the initial jobless claims for the week ending December 6 missed the expectation of 220k with a tally of 242k, up from the preceding week’s reported claim count of 225k. The producer price index for November outperformed the expected (MoM) change of 0.2% with a change of 0.4%. The (YoY) equivalent also beat 2.6% with a change of 3%. The producer price index ex-food and energy also outshone the forecasted (YoY) change of 3.2% with a change of 3.4%, while the (MoM) equivalent was in line with the estimate of 0.2%.
GBP/USD Technical Analysis (the 60-min Chart)
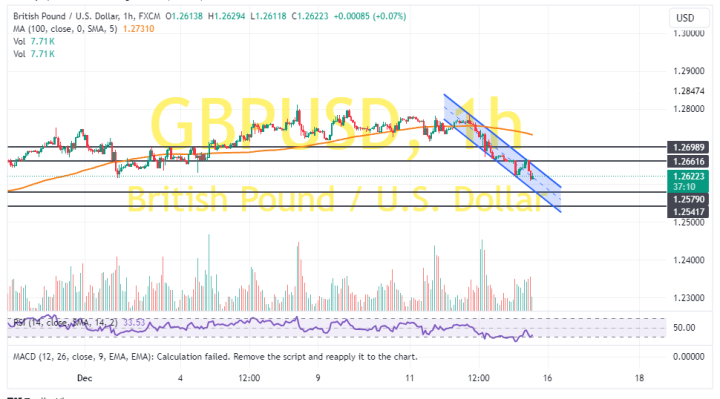
Technically, the GBP/USD currency pair trades within a descending channel formation in the 60-minute chart. The 14-hour RSI has also fallen to move closer to the oversold conditions of the indicator.
Therefore, the bears will look to extend the current declines toward 1.2590 or lower to 1.2541. On the other hand, the bulls will look to pounce on rebounds at about 1.2661 or higher at 1.2699.
GBP/USD Technical Analysis (the Daily Chart)

In the daily chart, the GBP/USD currency pair has recently completed a downward breakout from an ascending channel formation. The 14-day RSI has also pulled back to move closer to oversold conditions.
Therefore, the bears will look to extend the current pullback towards 1.2515 or lower to 1.2418. On the other hand, the bulls will be targeting profits at about 1.2717 or higher at 1.2815.