
The GBP/USD currency pair on Thursday pulled back off the session highs of about 1.2674 to trade at about 1.2644. The currency pair appears to have completed a downward breakout from an ascending channel formation in the 60-minute chart.
The pair has now fallen to trade a few levels below the 100-hour moving average line. As a result, the currency pair seems to be moving closer to the overbought levels of the 14-hour RSI.
GBP/USD Fundamentals Overview

From a fundamental perspective, the GBP/USD currency pair is trading at the back of a relatively busy period in both markets. In the UK, net lending to individuals for January missed the expectation of GBP 1.9 billion with a figure of GBP 0.8 billion (MoM).
The M4 money supply for the month also fell short of the (MoM) forecast of 0.3% with a change of -0.1%. The (YoY) equivalent fell by 2.2% compared to a change of -0.9% in the previous period. On the other hand, Mortgage approvals for January exceeded expectations of 52k with a tally of 55.227k.
In the US, the initial jobless claims for the week ending February 23 missed the expected claim count of 210k with a slightly higher tally of 215k. The preliminary personal consumption expenditures price index for January matched (MoM) and (YoY) expectations of 0.3% and 2.4%, respectively.
The preliminary core personal consumption expenditures price index for the period was also in line with the estimates of 0.4% (MoM) and 2.8% (YoY). The Chicago purchasing manager’s index for February fell to 44 down from 46 in the previous month, missing the estimated reading of 48.
GBP/USD Technical Analysis (the 60-min Chart)
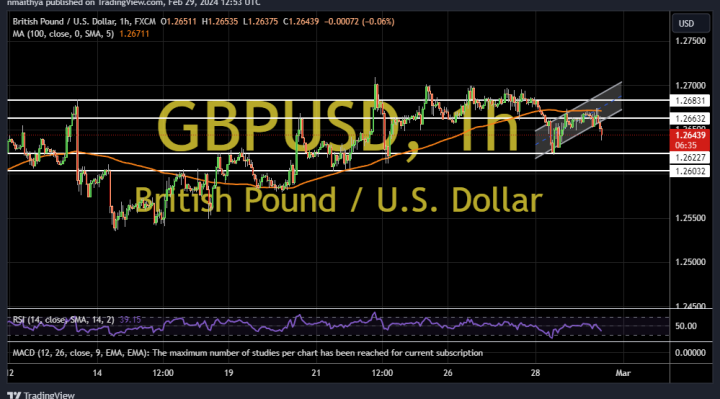
Technically, the GBP/USD currency pair appears to have recently completed a downward breakout from an ascending channel formation. The 14-hour RSI has also pulled back to move closer to oversold conditions.
Therefore, the bears will be targeting extended pullbacks at about 1.2622 or lower at 1.2603. On the other hand, the bulls will look to pounce on rebounds at about 1.2663 or higher at 1.2683.
GBP/USD Technical Analysis (the Daily Chart)
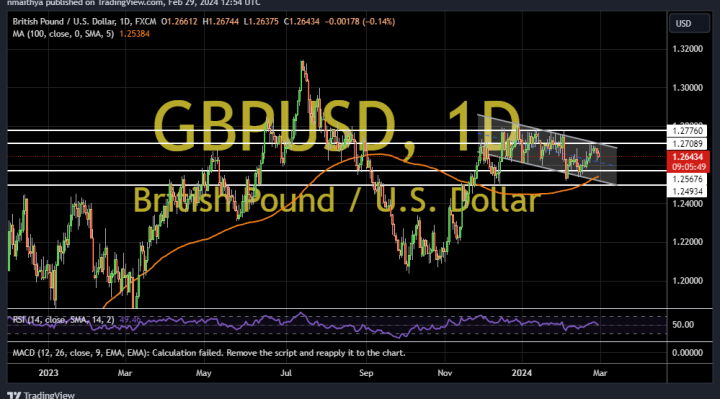
In the daily chart, the GBP/USD currency pair appears to be trading within a descending channel formation. The 14-day RSI also seems to support a bearish bias after pulling back to avoid rallying into overbought conditions.
Therefore, the bears will be targeting long-term pullbacks at about 1.2567 or lower at 1.2493. On the other hand, the bulls will look to pounce on profits at about 1.2709 or higher at 1.2776.