
The GBP/USD currency pair on Thursday pulled back off the session highs of about 1.2750 to trade at about 1.2725. The currency pair appears to be trading within an ascending channel formation in the 60-minute chart.
Despite the pullback, the pair continues to trade slightly above the 100-hour moving average line. As a result, the currency pair still seems to have a lot of room left to run before reaching the oversold levels of the 14-hour RSI.
GBP/USD Fundamentals Overview

From a fundamental perspective, the GBP/USD currency pair is trading at the back of a relatively busy period in both markets. On Thursday, the preliminary UK S&P Global/CIPS Composite PMI for May missed the expectation of 54 with a reading of 52.8. On the other hand, the preliminary S&P Global/CIPS Manufacturing PMI for the period outshone the estimate of 49.5 with a reading of 51.3, while the Services PMI missed the expectation of 54.7 with a reading of 52.9.
On Wednesday, the UK producer price index for April missed the expected (YoY) change of -1.2% with a change of -1.6%, while the (MoM) equivalent beat 0.4% with a change of 0.6%. The producer price index output for the period missed both the (MoM) and (YoY) expectations of 0.4% and 1.2%, respectively with changes of 0.2% and 1.1%. UK CPI for April came in higher than expected.
In the US, traders will be looking forward to the preliminary S&P Global Manufacturing and Services PMIs on Thursday and the durable goods data on Friday.
GBP/USD Technical Analysis (the 60-min Chart)
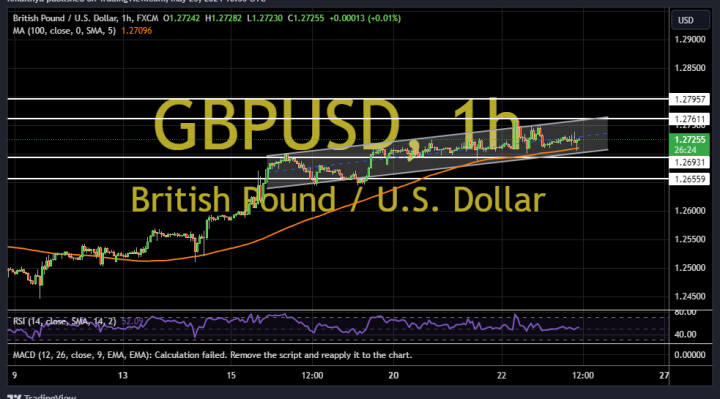
Technically, the GBP/USD currency pair appears to be trading within an ascending channel formation in the 60-minute chart. However, the 14-hour RSI still seems to have room left to run before entering overbought conditions.
Therefore, the bulls will be looking to ride the current rally towards 1.2761 or higher to 1.2795. On the other hand, the bears will look to pounce on pullbacks at about 1.2693 or lower at 1.2656.
GBP/USD Technical Analysis (the Daily Chart)
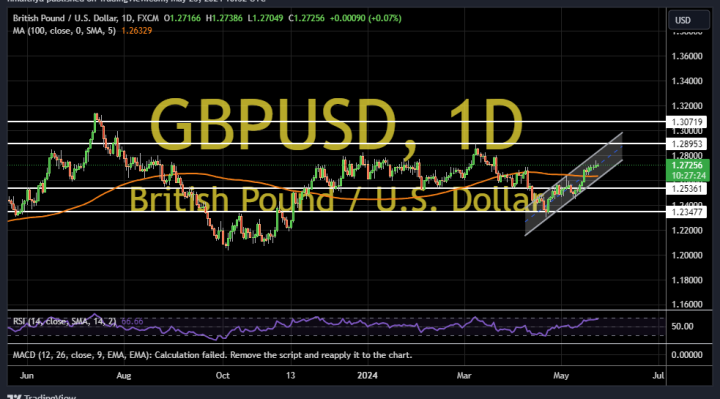
In the daily chart, the GBP/USD currency pair appears to be trading within an ascending channel formation. The 14-day RSI also seems to support a long-term bullish bias as it edges closer to overbought conditions.
Therefore, the bulls will be looking to ride the current run of gains toward 1.2895 or higher to 1.3072. On the other hand, the bears will look to pounce on pullbacks at about 1.2536 or lower at 1.2347.