
On Thursday, the GBP/USD currency pair pulled back off the session highs of about 1.2849 to trade at about 1.2751. The currency pair trades within a descending channel formation in the 60-minute chart.
The pair plummeted to trade a few levels below the 100-hour moving average line. As a result, the currency pair is on the verge of re-entering the oversold levels of the 14-hour RSI.
GBP/USD Fundamentals Overview

From a fundamental perspective, the GBP/USD currency pair trades during a relatively busy period in both markets. On Thursday, the Bank of England voted to trim the base interest rate by 25 basis points to 5%, down from 5.25% in the previous update, in line with expectations. The vote was split 5 against 4 in favour of a rate cut versus keeping the rate unchanged.
In the US, the initial jobless claims for the week ending July 26 missed the expected claim count of 236k with a significantly higher tally of 249k. The preliminary nonfarm productivity for Q2 outshone the forecast of 1.7% with 2.3%, while unit labour costs for the quarter fell short of 1.8% with a change of 0.9%.
On the other hand, the ISM Manufacturing PMI for July missed the expected reading of 48.8 with a reading of 46.8. The ISM Manufacturing Prices Paid beat 51.8 with 52.9, while the Manufacturing Employment Index missed 49 with 43.4. Traders will be looking forward to the US nonfarm payroll data and the unemployment rate for July on Friday.
GBP/USD Technical Analysis (the 60-min Chart)
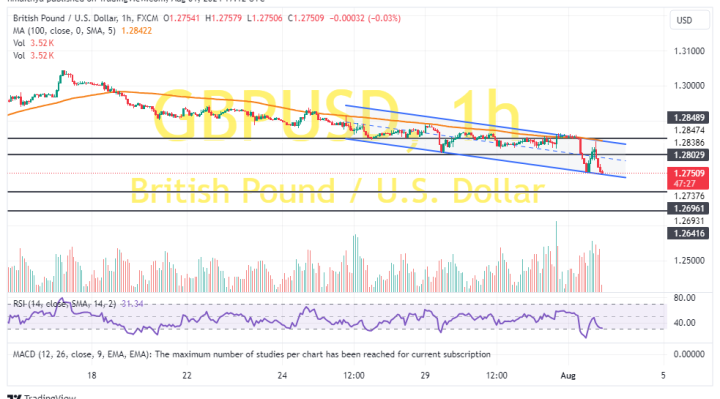
Technically, the GBP/USD currency pair trades within a descending channel formation in the 60-minute chart. The 14-hour RSI has also pulled back to move closer to the oversold levels, supporting a bearish bias.
Therefore, the bears will look to extend the current run of declines toward 1.2696 or lower to 1.2641. On the other hand, the bulls will look to pounce on rebounds at about 1.2803 or higher at 1.2849.
GBP/USD Technical Analysis (the Daily Chart)
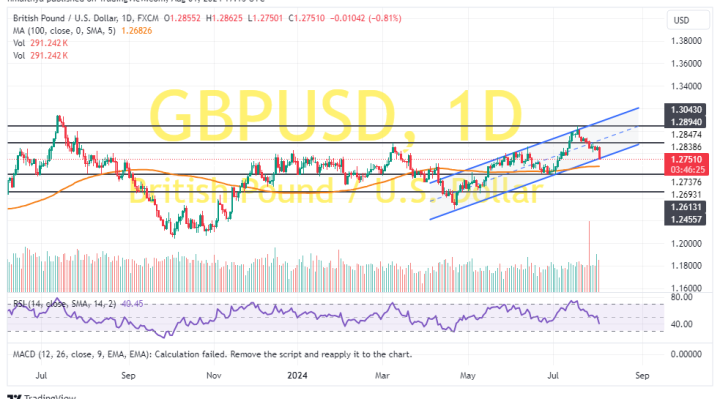
In the daily chart, the GBP/USD currency pair trades within an ascending channel formation. However, the 14-day RSI has recently pulled back to avoid rallying into the overbought levels of the indicator.
Therefore, the bears will be targeting extended pullbacks at about 1.2613 or lower at 1.2455. On the other hand, the bulls will look to pounce on profits at about 1.2894 or higher at 1.3043.