
The GBP/USD currency pair on Wednesday pulled back off the session highs of about 1.2809 to trade at about 1.2798. The currency pair continues to trade within an ascending channel formation in the 60-minute chart.
The pair has now advanced to trade closer to the 100-hour moving average line. However, the currency pair still seems to have more room left to run before reaching the overbought levels of the 14-hour RSI.
GBP/USD Fundamentals Overview

From a fundamental perspective, the GBP/USD currency pair is trading at the back of a relatively busy period in both markets. On Wednesday, the UK industrial production for January missed the expected (MoM) change of 0% with a change of -0.2%. The (YoY) equivalent also fell short of 0.7% with a change of 0.5%.
On the other hand, the Manufacturing Production for the period matched both the (MoM) and (YoY) forecasts of 0% and 2%, respectively. The gross domestic product for the month was also in line with the estimate of 0.2%.
In the US, the consumer price index edged slightly higher to 3.2% (YoY) up from 3.1% in January, beating the forecast of 3.1%. The (MoM) equivalent was in line with the estimate of 0.4%.
On the other hand, the consumer price index ex-food and energy for the period exceeded the forecasted (MoM) and (YoY) changes of 0.3% and 3.7%, respectively with changes of 0.4% and 3.8%. Traders will be looking forward to the retail sales data and the producer price index for February on Thursday.
GBP/USD Technical Analysis (the 60-min Chart)
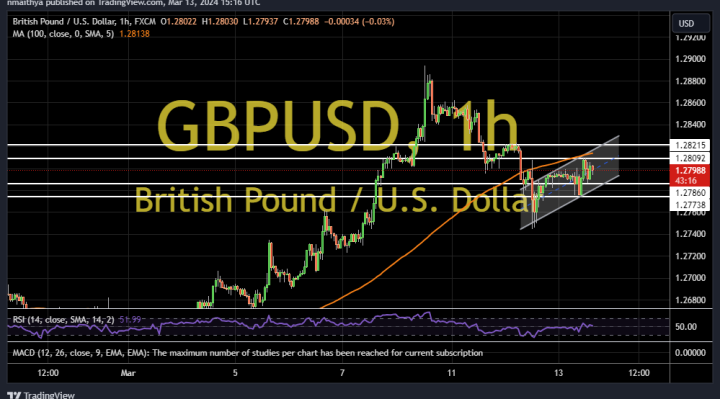
Technically, the GBP/USD currency pair appears to be trading within an ascending channel formation in the 60-minute chart. However, the 14-hour RSI still seems to have a lot of room left to run before reaching overbought conditions.
Therefore, the bulls will be targeting extended rebounds at about 1.2809 or higher at 1.2821. On the other hand, the bears will look to pounce on pullbacks at about 1.2786 or lower at 1.2773.
GBP/USD Technical Analysis (the Daily Chart)
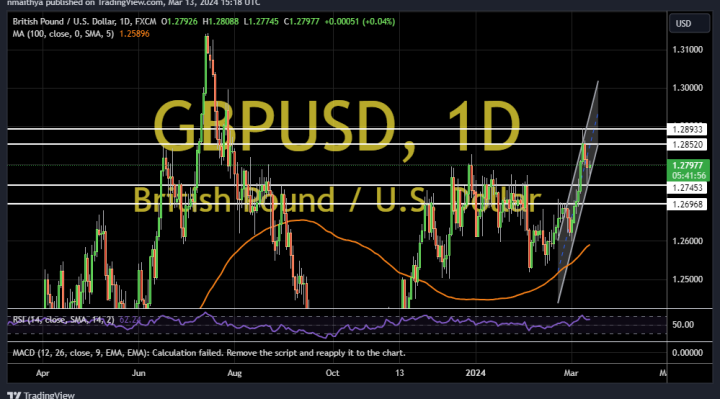
In the daily chart, the GBP/USD continues to trade within a sharply ascending channel formation. However, the 14-day RSI has recently pulled back to avoid rallying into overbought conditions.
Therefore, the bears will be targeting extended pullbacks at about 1.2745 or lower at 1.2696. On the other hand, the bulls will be looking to ride the current rally towards 1.2857 or higher to 1.2893.