
On Thursday, the GBP/USD currency pair pulled back from the session highs of about 1.3339 to trade at about 1.3274. The currency pair trades within a descending channel formation in the 60-minute chart.
The pair has now plummeted to trade a few levels below the 100-hour moving average line. As a result, the currency pair is on the verge of entering the oversold levels of the 14-hour RSI.
GBP/USD Fundamentals Overview

From a fundamental perspective, the GBP/USD currency pair trades during a relatively busy period in the U.S. market. On Thursday, the U.S. initial jobless claims for the week ending April 25 missed the expected claim count of 224k with a tally of 241k, up from the preceding week’s equivalent of 223k. On the other hand, the ISM Manufacturing PMI for April beat the expected reading of 48 with a reading of 48.7, while the ISM Manufacturing Prices Paid fell short of 70.3 with a reading of 69.8.
On Wednesday, the ADP employment change for April fell to 62k down from 147k, missing the forecast of 108k. The preliminary annualised gross domestic product for Q1 also fell short of 0.4% with a change of -0.3%, down from 2.4% in Q4 2024, while the pending home sales for March outshone the estimated change of -0.3% with a change of 6.1%.
The personal consumption expenditures – price index for the period exceeded the (YoY) forecast of 2.2% with a change of 2.3%, while the core personal consumption expenditures price – index for the month missed the (MoM) forecast of 0.1% with a change of 0%. Elsewhere, personal income for March exceeded the (MoM) expectation of 0.4% with a change of 0.5%, while personal spending for the period beat 0.6% with 0.7%.
GBP/USD Technical Analysis (the 60-min Chart)
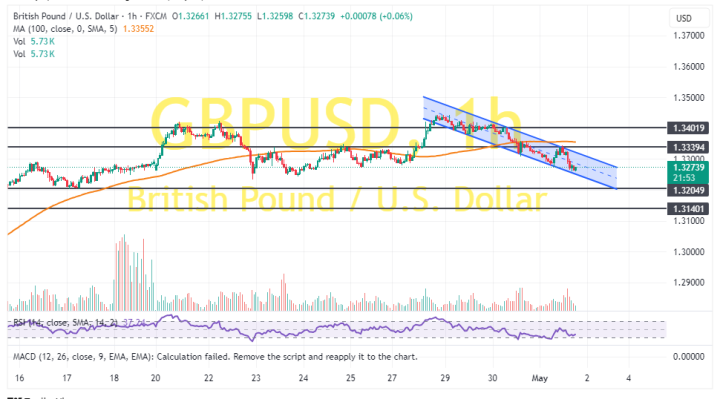
Technically, the GBP/USD currency pair trades within a descending channel formation in the 60-minute chart. The 14-hour RSI also supports a bearish bias as it moves closer to oversold conditions.
Therefore, the bears will look to stretch the current run of declines toward 1.3205 or lower to 1.3140. On the other hand, the bulls will look to pounce on rebounds at about 1.3339 or higher at 1.3402.
GBP/USD Technical Analysis (the Daily Chart)
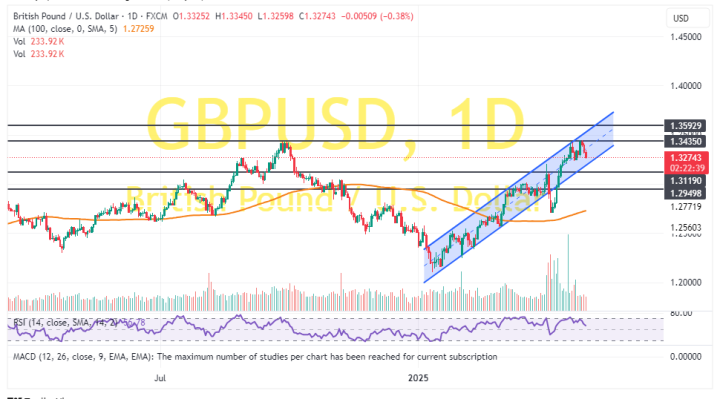
In the daily chart, the GBP/USD currency pair trades within an ascending channel formation. However, the 14-day RSI has recently pulled back to avoid rallying into overbought conditions.
Therefore, the bears will look to extend the current pullback towards 1.3119 or lower to 1.2949. On the other hand, the bulls will look to ride the current rally towards 1.3435 or higher to 1.3593.