
On Thursday, the GBP/USD currency pair pulled back from the session highs of about 1.3356 to trade at about 1.3324. The currency pair trades within a descending channel formation in the 60-minute chart.
As a result, the pair continues to trade a few levels below the 100-hour moving average line. However, the currency pair made a late rebound to avoid falling into the oversold conditions of the 14-hour RSI.
GBP/USD Fundamentals Overview

From a fundamental perspective, the GBP/USD currency pair trades during a relatively busy period in the UK market. On Wednesday, the UK consumer price index for September missed the (YoY) forecast of 4%, with 3.8%, unchanged from the previous period. The core consumer price index for the month also fell short of 3.7%, with 3.5%, down from 3.6%.
On the other hand, the seasonally-adjusted producer price index – input for September fell short of 0.3%, with -0.1% (MoM), while the non-seasonally-adjusted producer price index – output fell short of 0.2%, with 0%. The retail price index for the month missed both the (MoM) and (YoY) expectations of -0.1% and 4.7%, respectively, with -0.4% and 4.5%.
In the U.S., Congress failed to agree on compensation for Federal essential workers, further extending the government shutdown. It is now the second-longest running shutdown in U.S. history. In the latest US economic data, existing home sales for September missed the expectation of 4.1 million with a tally of 4.06 million, up from the preceding month’s equivalent of 4 million. Existing home sales change also improved to 1.5%, up from -0.2%.
GBP/USD Technical Analysis (the 60-min Chart)
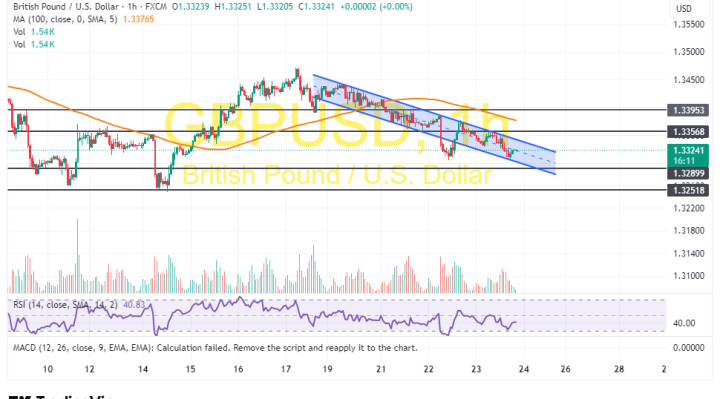
Technically, the GBP/USD currency pair trades within a descending channel formation in the 60-minute chart. However, the 14-hour RSI has recently bounced back to avoid falling into oversold conditions.
Therefore, the bulls will look to extend Thursday’s late rebound towards 1.3356 or higher to 1.3395. On the other hand, the bears will look to ride the current run of declines toward 1.3290 or lower to 1.3251.
GBP/USD Technical Analysis (the Daily Chart)

In the daily chart, the GBP/USD currency pair trades within a descending channel formation. However, the 14-day RSI still has some room left to run before reaching oversold conditions.
Therefore, the bears will look to ride the current run of declines toward 1.3166 or lower to 1.3025. On the other hand, the bulls will look to pounce on rebounds at about 1.3474 or higher at 1.3619.