
On Thursday, the GBP/USD currency pair pulled back from the session highs of about 1.3550 to trade at about 1.3449. The currency pair also completed a downward breakout from an ascending channel formation in the 60-minute chart.
The pair has now fallen to trade a few levels below the 100-hour moving average line. As a result, the currency pair is on the verge of entering the oversold levels of the 14-hour RSI.
GBP/USD Fundamentals Overview

From a fundamental perspective, the GBP/USD currency pair trades during a relatively busy period in the U.S. market. On Thursday, the US initial jobless claims for last week came in slightly lower than expected, with 212k versus a forecast of 215k, up from the previous week’s claim count of 208k. The continuing claim for the preceding 4-week period fell to 1.833 million, down from 1.864 million, beating the forecasted claim count of 1.86 million.
Earlier in the week, the US housing price index for December missed the expected (MoM) change of 0.3%, with a change of 0.1%. The S&P/Case-Shiller Home Price Indices for the month also fell short of 1.5%, with a change of 1.4%. The Richmond Fed Manufacturing Index for February fell to -10, down from -6, missing the forecasted reading of -4, while wholesale inventories for December matched the forecasted (MoM) change of 0.2%.
Looking forward, traders will be waiting for the US producer price index data for January on Friday, ahead of the Chicago Purchasing Managers’ Index for February later in the day.
GBP/USD Technical Analysis (the 60-min Chart)
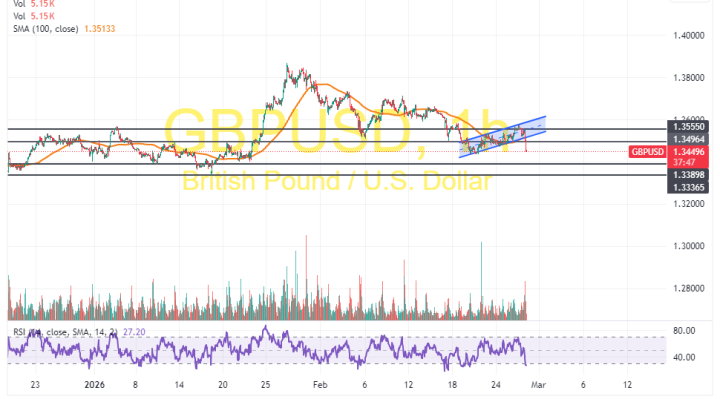
Technically, the GBP/USD currency pair has completed a downward breakout from an ascending channel formation in the 60-minute chart. The 14-hour RSI has also pulled back to move closer to oversold conditions.
Therefore, the bears will look to stretch the latest pullback towards 1.3389 or lower to 1.3336. On the other hand, the bulls will look to pounce on rebounds at about 1.3496 or higher at 1.3555.
GBP/USD Technical Analysis (the Daily Chart)
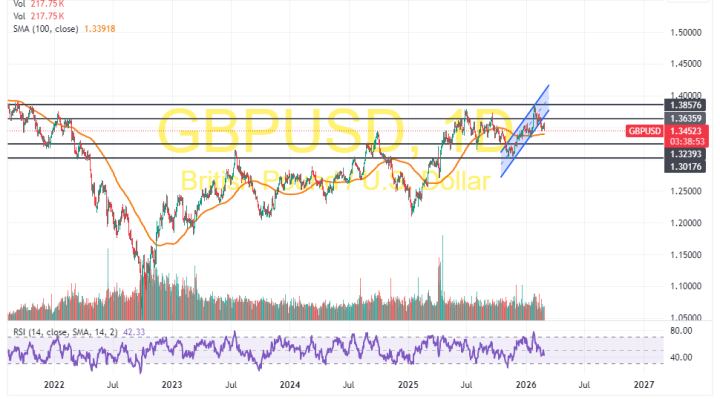
In the daily chart, the GBP/USD has also completed a downward breakout from an ascending channel formation. The 14-day RSI has also pulled back to recover from overbought conditions.
Therefore, the bears will look to extend the latest pullback towards 1.3239 or lower to 1.3017. On the other hand, the bulls will look to pounce on profits at about 1.3636 or higher at 1.3857.