
On Thursday, the GBP/USD currency pair pulled back from the session highs of about 1.3731 to trade at about 1.3540. The currency pair trades within a descending channel formation in the 60-minute chart.
The pair has now fallen to trade a few levels below the 100-hour moving average line. As a result, the currency pair is on the verge of entering the oversold levels of the 14-hour RSI.
GBP/USD Fundamentals Overview

From a fundamental perspective, the GBP/USD currency pair trades during a relatively busy period in the U.S. market. On Thursday, the initial jobless claims for last week increased to 231k, up from the previous week’s claim count of 209k, missing the forecast of 212k. The JOLTS job openings for December also fell short of the forecasted tally of 7.2 million, with a tally of 6.542 million, down from the preceding month’s 6.928 million. Earlier in the week, the
ISM Services PMI for January came in better than expected, with 53.8 versus a forecast of 53.5, up from 53.5 in December. The ISM Services Employment Index for the month fell short of 52.3, with a reading of 50.3, down from 51.7, while the S&P Global Composite PMI for the period outshone the forecast of 52.8, with a reading of 53, up from 52.8.
On the other hand, the ADP employment change for January missed the expectation of 48k, with a tally of 22k, down from the previous month’s equivalent of 37k.
In the UK, the Bank of England voted to keep the base interest rate unchanged at 3.75%, in line with expectations. Five out of nine committee members voted for no change, wth the remaining four voting for a rate cut.
GBP/USD Technical Analysis (the 60-min Chart)
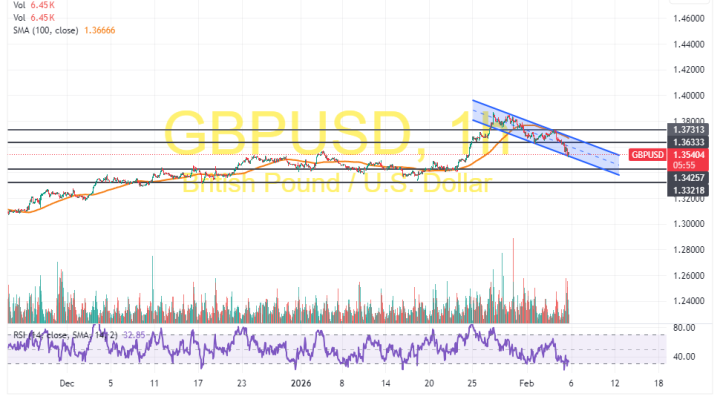
Technically, the GBP/USD currency pair trades within a descending channel formation in the 60-minute chart. The 14-hour RSI also supports a bearish bias as it edges closer to oversold conditions.
Therefore, the bears will look to extend the current pullback towards 1.3425 or lower to 1.3321. On the other hand, the bulls will look to pounce on rebounds at about 1.3633 or higher at 1.3731.
GBP/USD Technical Analysis (the Daily Chart)
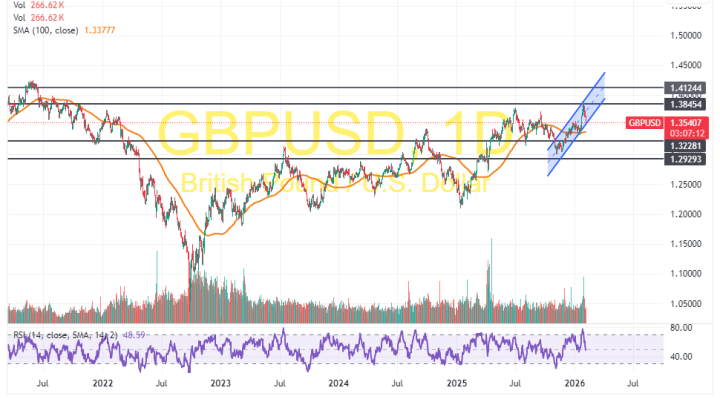
In the daily chart, the GBP/USD currency pair trades within an ascending channel formation. However, the 14-day RSI has recently pulled back to recover from overbought conditions.
Therefore, the bears will look to stretch the latest pullback towards 1.3228 or lower to 1.2929. On the other hand, the bulls will look to ride the current run of gains toward 1.3845 or higher to 1.4124.