
The GBP/USD currency pair on Thursday puled back off the current weekly highs of about 1.3928 to trade at around 1.3850 following the latest round of data. The pair continues to trade within a sideways channel formation in the 60-min chart.
It is now pinned just above the confluence of the 100-hour and the 200-hour SMA lines. Thursday’s late pullback prevented the currency pair from crossing to the overbought levels of the 14-hour RSI. It has now moved back centrally in the normal trading zone.
GBP/USD Fundamentals Overview

From a fundamental perspective, the GBP/USD currency pair is trading at the back of a relatively busy period in both markets. On Thursday, the Bank of England voted nine to nothing in favor of keeping the base interest rate unchanged at 0.1%. The BoE governor Bailey said that negative shock will be needed for more QE in 2022. This confirms earlier reports of a possible tapering of the QE. Earlier in the week, the UK Markit Manufacturing PMI for April narrowly beat the expectation of 60.7 with 60.9.
In the US, the initial jobless claims for the week ending April 30 beat the expected claim count of 540k with 498k. The continuing claims missed expectations. Earlier in the week, the US ISM services PMI for April missed the expectation of 64.3 with 62.7. The ADP employment change for the period also missed the expected job count of 800k with a tally of 742k. The ISM Manufacturing PMI failed to match the expectation of 65 with 60.7 on Monday.
GBP/USD Technical Analysis (the 60-min Chart)
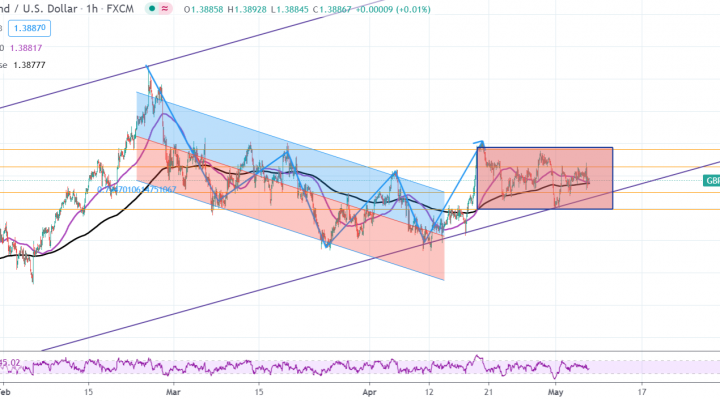
Technically, the GBP/USD currency pair appears to be trading within a sideways channel formation in the 60-min chart. It has recently pulled back to avoid venturing into the overbought levels of the 14-hour RSI.
The bulls will be targeting potential bullish breakouts from the channel at around 1.3928 or higher at 1.3983. On the other hand, the bears will look to pounce on potential pullbacks at 1.3850 or lower at 1.3797.
GBP/USD Technical Analysis (the Daily Chart)
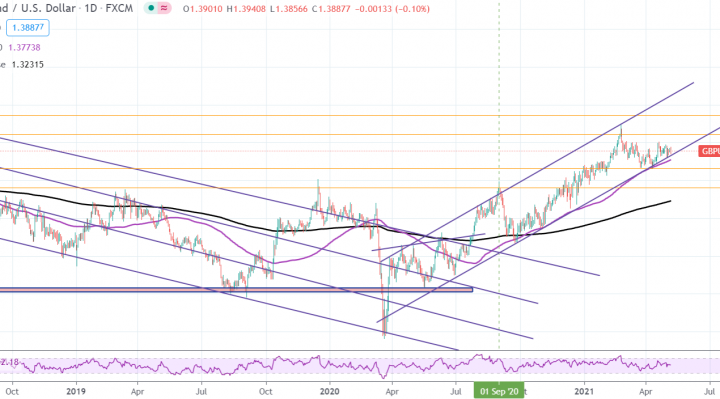
The GBP/USD currency pair continues to trade in an ascending channel formation in the daily chart. This indicates a significant long-term bullish bias in the market sentiment. It remains above the 100-day and the 200-day SMA lines.
The bulls will be looking to ride the current bull-run towards 1.4110 or higher to 1.4360. On the other hand, the bears will target long-term pullback profits at around 1.3657 or lower at 1.3403.