
On Thursday, the GBP/USD currency pair pulled back from the current week’s highs of about 1.3392 to trade at about 1.3376. The currency pair has recently completed an upward breakout from a descending channel formation in the 60-minute chart.
The pair continues to trade a few levels above the 100-hour moving average line, despite the pullback. Thursday’s pullback prevented the currency pair from ascending into the overbought levels of the 14-hour RSI.
GBP/USD Fundamentals Overview

From a fundamental perspective, the GBP/USD currency pair trades during a relatively busy period in the U.S. market. On Wednesday, the Economic Cost Index for Q3 missed the expected change of 0.9%, with a change of 0.8%. The Federal Reserve lowered the base interest rate by 25 basis points to 3.75%, down from 4%, in line with expectations.
The one-year, 2-year, and 3-year interest rate projections remained unchanged at 3.4%, 3.1%, and 3.1%, respectively. The projection for the current year and long-term estimates were also unchanged at 3.6% and 3%, respectively. On the other hand, the monthly budget statement for November improved to $-173 billion, up from $-284 billion, beating the forecasted budget of $-205 billion.
In the UK, the BRC Like-for-Like retail sales for November missed the expected (YoY) change of 2.4%, with a change of 1.2%. Traders will be looking forward to the UK gross domestic product data for October, and the manufacturing production and the industrial production data for the month on Friday.
GBP/USD Technical Analysis (the 60-min Chart)
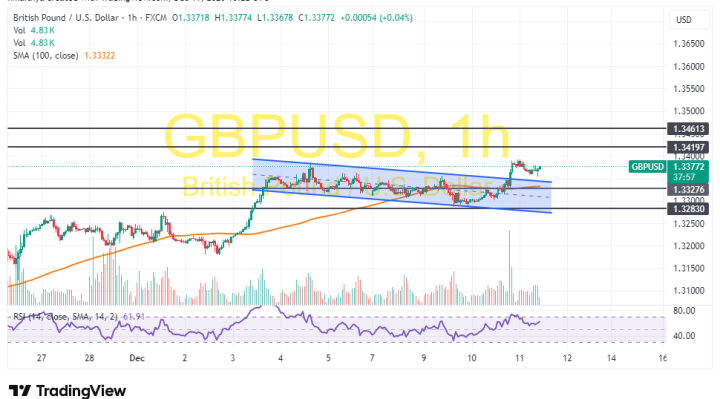
Technically, the GBP/USD currency pair has completed an upward breakout from a descending channel formation. However, the 14-hour RSI has recently pulled back to avoid rallying into overbought conditions.
Therefore, the bears will look to stretch the latest pullback towards 1.3327 or lower to 1.3283. On the other hand, the bulls will look to pounce on profits at about 1.3419 or higher at 1.3461.
GBP/USD Technical Analysis (the Daily Chart)

In the daily chart, the GBP/USD currency pair trades within an ascending channel formation. The 14-day RSI also supports a long-term bullish bias as it edges closer to overbought conditions.
Therefore, the bulls will look to stretch the current run of gains toward 1.3557 or higher to 1.3747. On the other hand, the bears will look to pounce on pullbacks at about 1.3179 or lower at 1.7975.