
The GBP/USD currency pair on Wednesday pulled back off the session highs of about 1.2498 to trade at about 1.2440. The currency pair appears to be trading within a gently ascending channel formation in the 60-min chart.
Wednesday’s pullback pushed the currency pair below the 100-hour moving average line. This prevented the currency pair from ascending into the overbought levels of the 14-hour RSI.
GBP/USD Fundamentals Overview

From a fundamental perspective, the GBP/USD currency pair is trading at the back of a relatively busy period in the US market. On Wednesday, the US goods and services trade balance for April outperformed the expectation of $-75.2 billion with a figure of $-74.6 billion.
Earlier in the week, the ISM Services PMI for May missed the expectation of 51.5 with a reading of 50.3. The ISM Services Prices Paid, New Orders Index and Employment Index all missed the estimated readings of 57.8, 56.5 and 51, respectively with 56.2, 52.9 and 49.2. Factory orders for April also fell short of 0.5% with a change of 0.4% (MoM), while the S&P Global Services and Composite PMIs missed 55.1 and 54.5, respectively with 54.9 and 54.3.
In the UK, the S&P Global/CIPS Composite PMI for May beat the expected reading of 53.9 with a reading of 54, while the Services PMI outshone the estimate of 55.1 with 55.2. The BRC Like-for-Like Retail Sales for May grew by 3.7% (YoY) compared to a growth rate of 5.2% in the previous period. The S&P Global Construction PMI also outshone 51.1 with a reading of 51.6.
GBP/USD Technical Analysis (the 60-min Chart)
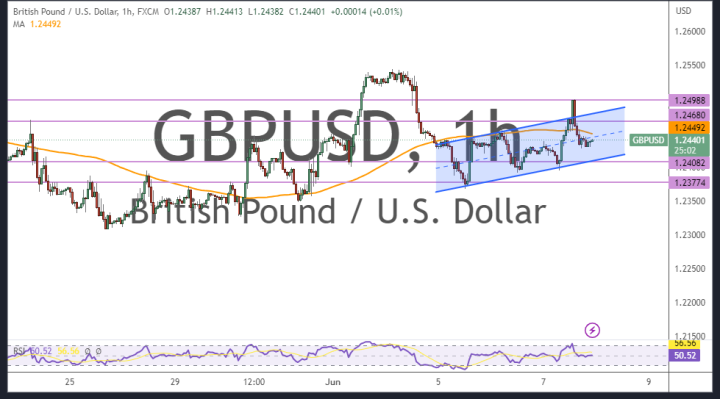
Technically, the GBP/USD currency pair appears to be trading within a gently ascending channel formation in the 60-min chart. This indicates a slight short-term bullish bias in the market sentiment.
Therefore, the bulls will be targeting short-term profits at about 1.2468 or higher at 1.2498. On the other hand, the bears will look to pounce on profits at about 1.2408 or lower at 1.2377.
GBP/USD Technical Analysis (the Daily Chart)
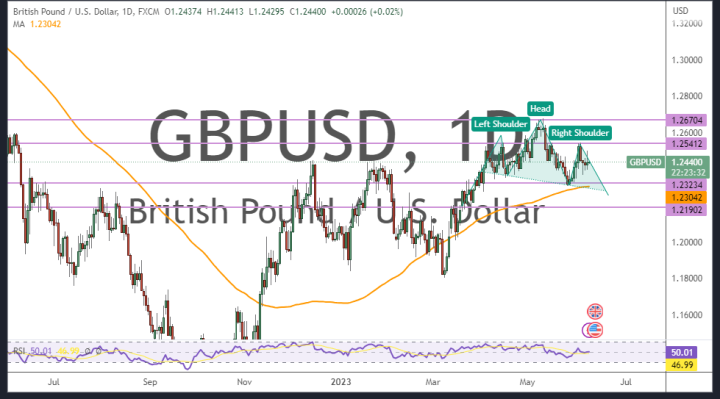
In the daily chart, the GBP/USD currency pair appears to be about to complete a head-and-shoulders pattern formation. This indicates an attempt by the bears to take control of the pair.
Therefore, they will be targeting extended pullbacks at about 1.2323 or lower at 1.2190. On the other hand, the bulls will be targeting long-term profits at about 1.2541 or higher at 1.2670.