
The GBP/USD currency pair on Friday surged to set a new monthly high of about 1.3656 before pulling back late on to erase session gains. The currency pair continues to trade within a gently ascending channel formation in the 60-min chart.
The currency pair now trades just above the 100-hour moving average following Friday’s late pullback. It has also edged lower to trade in the mid-section of the 14-hour RSI.
GBP/USD Fundamentals Overview

From a fundamental perspective, the GBP/USD currency pair is trading at the back of a relatively busy period in the US market. On Friday, the US non-farm payrolls were disappointing with 194k jobs compared to the expectation of 500k. On the other hand, the unemployment rate for September outperformed the expectation of 5.1% with a rate of 4.8%, down from 5.2% in August, while the average weekly hourly wage growth rate was in line with the (YoY) estimate of 4.6%. Earlier in the week, the ISM Services PMI outperformed the expectations of 60 with 61.9 while the ADP EMployment change beat 428k with 568k.
In the UK, the Halifax House Prices for the 3-month period ended September beat the (YoY) expectation of 4.9% with a change of 7.4%, while the (MoM) change for September outshone 0.8% with 1.7% on Thursday. Earlier in the week, the UK Markit Manufacturing PMI for September misses the expectation of 54 with 52.6, while the Markit Services PMI beat 54.6 with 55.4.
GBP/USD Technical Analysis (the 60-min Chart)
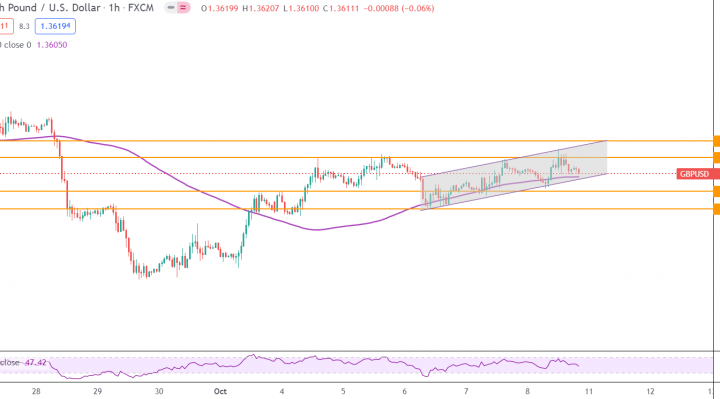
Technically, the GBP/USD currency pair appears to be trading within a gently ascending channel formation in the 60-min chart. This indicates a slight short-term bearish bias in the market sentiment.
Therefore, the bulls will be looking to stretch the current gains towards 1.3641 or higher to 1.3673. On the other hand, the bears will target potential pullbacks at 1.3577 or lower at 1.3544.
GBP/USD Technical Analysis (the Daily Chart)
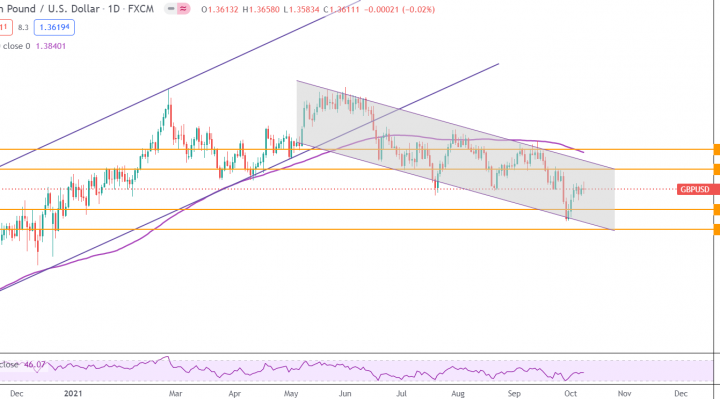
In the daily chart, the GBP/USD currency pair appears to be trading within a descending channel formation. However, the currency pair has recently bounced back to avoid slipping to the oversold conditions of the 14-day RSI.
Therefore, the bulls will look to pounce for long-term profits at around 1.3733 or higher at 1.3858. On the other hand, the bears will target extended declines at around 1.3482 or lower at 1.3356.