
The GBP/USD currency pair on Friday pulled back to trade at around 1.3535 following the latest round of US non-farm payrolls data. The currency pair continues to trade within an ascending wedge formation in the 60-min chart.
The pair is now pinned between the 100-hour and the 200-hour SMA lines. The latest pullback prevented the currency pair from crossing to overbought levels of the 14-hour RSI.
GBP/USD Fundamentals Overview

The GBP/USD currency pair is trading at the back of a relatively busy period in the US market. On Friday, the US non-farm payrolls data for December missed the expectation of 71k jobs with -140k jobs. The (YoY) change in average hourly wage beat the expectation of 4.4% with a change of 5.1%. On the other hand, the unemployment rate outperformed the estimated rate of 6.8% after it remained unchanged from November at 6.7%.
Earlier in the week, the US ISM Services PMI for December beat the expectation of 54.6 with 57.2. The ISM Services New Orders Index also outperformed 54.9 with 58.5. On the other hand, both the ISM Services Prices Paid and Services Employment Index missed the expectations of 65.2 and 50.7 with 64.8 and 48.2, respectively.
In the UK, Halifax House Prices for December missed the (MoM) expectation of 0.5% with a change of 0.2%. The Markit Construction PMI for December also came short of 55 with 54.6 while the Markit Services PMI narrowly missed 49.9 with 49.4. Earlier in the week, the Markit Manufacturing PMI beat 57.3 with 57.5.
GBP/USD Technical Analysis (the 60-min Chart)

Technically, the GBP/USD currency pair appears to be trading within an ascending wedge formation in the 60-min chart. This indicates a short-term bullish bias in the market sentiment.
The bulls will be looking to extend the current bull-run towards 1.3599 or higher to 1.3634. On the other hand, the bears will look to pounce for profits at around 1.3531 or lower at 1.3492.
GBP/USD Technical Analysis (the Daily Chart)
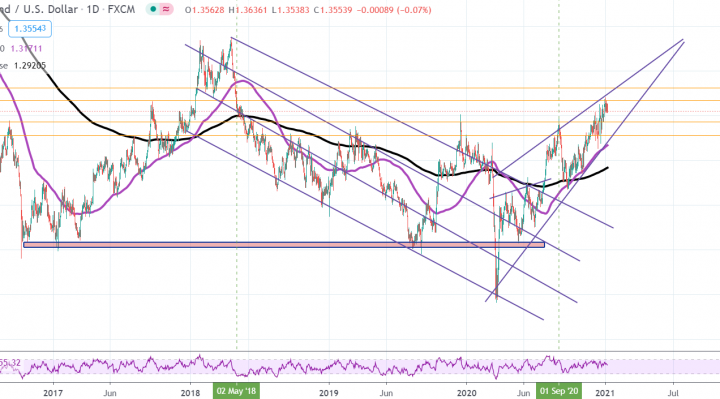
In the daily chart, the GBP/USD currency pair appears to be trading within an ascending consolidative triangle formation. This indicates a significant long-term bullish bias in the market sentiment.
The bulls will be looking to ride the current bull-run by targeting profits at around 1.3674 or higher at 1.3813. On the other hand, the bears will target pullbacks at around 1.3428 or lower at 1.3277.