
The GBP/USD currency pair on Friday skyrocketed to hit a new yearly high of about 1.3320 before pulling back late on to trade at 1.3287. This came following the latest round of US spending and consumption data.
The currency pair continues to trade within a slightly ascending channel in the 60-min chart. It has since surged several levels above the 100-hour and the 200-hour SMA lines. Friday’s late pullback pushed it back to trade within the normal trading zone. It had ventured into overbought levels of the 14-hour RSI earlier on.
GBP/USD Fundamentals Overview

From a fundamental perspective, the GBP/USD currency pair is trading at the back of a relatively busy period in the US market. On Friday, the US core personal consumption expenditure-price index for July missed the (MoM) expectation of 0.5% with 0.3%. The general personal consumption expenditure-price index also came short of 1.2% (MoM) with a change of 1%. On the other hand, personal income rose 0.4% compared to an expected decline of 0.2% (MoM) while personal spending beat 1.5% with 1.9%. The core personal consumption expenditure-price index for the month beat the (YoY) expectation of 1.2% with 1.3%.
On the other hand, the Chicago Purchasing Managers Index for August missed the expectation of 52 with 51.2 while the Michigan Consumer Sentiment Index outperformed 72.8 with 74.1. Earlier in the week, the preliminary US GDP for Q2 beat expectations on a (YoY) basis but missed the (QoQ) estimate. Initial and continuing jobless claims both came short of expectations while durable goods orders for July beat 4.3% with 11.2%. Nondefense capital goods order ex-aircraft matched expectations of 1.9%.
GBP/USD Technical Analysis (the 60-min Chart)

Technically, the GBP/USD currency pair appears to be experiencing a slight short-term bullish bias in the market sentiment. The pair remains pinned within a slightly rising channel in the 60-min chart.
The bulls will target short-term profits at around 1.3350 or higher at 1.3400. On the other hand, the bears will look to pounce on pullback profits at around 1.3250 or lower at 1.3200.
GBP/USD Technical Analysis (the Daily Chart)
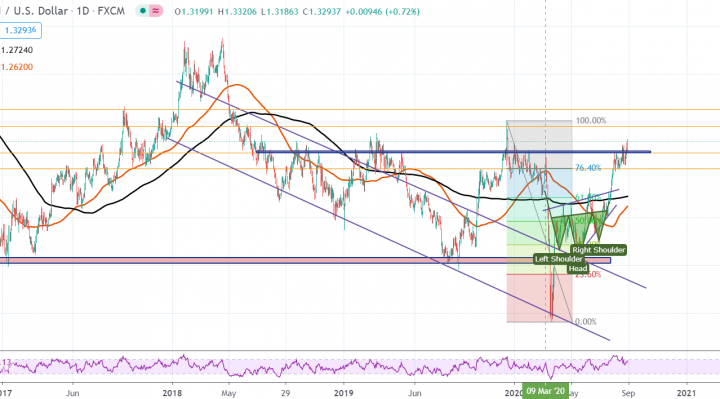
In the daily chart, the GBP/USD currency pair appears to be trading under strong bullish pressure. The pair maintains a bullish outlook since bottoming at new multi-year lows in March. It hs recouped more than 90% of the losses since then.
The bulls will target long-term profits at around 1.3453 or higher at 1.3629. On the other hand, the bears will look to pounce on long-term pullbacks at around 1.3174 or lower at 76.40% Fib level at 1.3013.