
The GBP/USD currency pair on Friday halted the current downward movement and instead traded sideways following the latest round of US data. The currency pair now appears to have found support at about 1.2332 after the US department of labour returned mixed jobs data.
The pair continues to trade within a descending channel formation in the 60-min chart. It has since fallen several levels below the 100-hour moving average line. However, it edged slightly upwards on Friday to recover from oversold conditions of the 14-hour RSI.
GBP/USD Fundamentals Overview

From a fundamental perspective, the GBP/USD currency pair is trading at the back of a relatively busy period in both markets. On Friday, the US non-farm payrolls for April outperformed the expectation of 391k with 428k jobs. However, the unemployment rate remained unchanged at 3.6% missing the consensus market forecast of 3.5%.
The average hourly earnings for the period also failed to match the expected (MoM) growth rate of 0.4% with a change of 0.3%, while the (YoY) equivalent matched the estimate of 5.5%. Earlier in the week, both the ISM Manufacturing and Services PMIs missed expectations, while the ADP employment change also came short of estimates.
In the UK, Halifax House Prices for April beat both the (MoM) and (YoY) expectations of 0.8% and 10.1%, respectively with 1.1% and 10.8%. The UK’s S&P Global Construction PMI for the period also outshone the estimate of 58 with 58.2. Earlier in the week, the Bank of England raised the base interest rate from 0.75% to 1%.
GBP/USD Technical Analysis (the 60-min Chart)
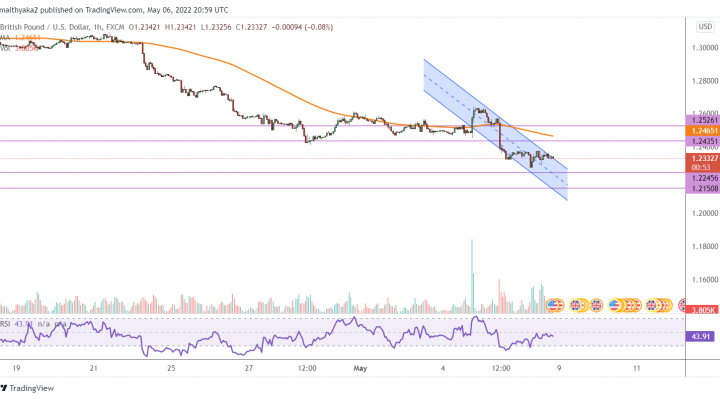
Technically, the GBP/USD currency pair seems to be trading within a descending channel formation in the 60-min chart. This indicates a short-term bearish bias in the market sentiment.
Therefore, the bears will be looking to retain control of the currency pair by targeting profits at about 1.2245 or lower at 1.2150. On the other hand, the bulls will be targeting potential rebounds at about 1.2435, or higher at 1.2526.
GBP/USD Technical Analysis (the Daily Chart)
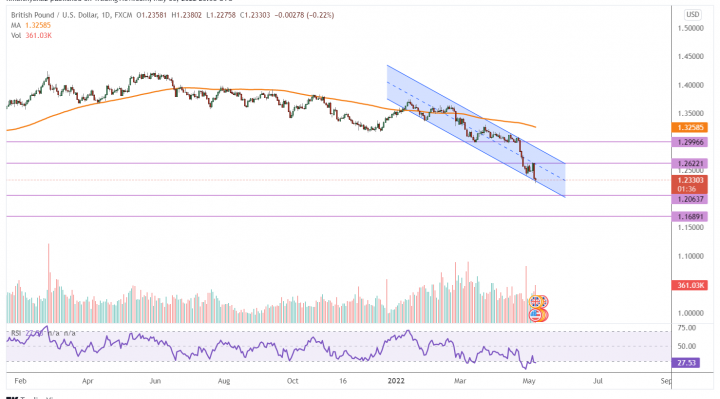
In the daily chart, the GBP/USD currency pair seems to be trading within a descending channel formation. This indicates a significant long-term bearish bias in the market sentiment.
Therefore, the bears will be looking to ride the current trend formation towards 1.2063 or lower to 1.1689. On the other hand, the bulls will be targeting long-term profits at about 1.2622, or higher at 1.2996.