
Analyzing the ups and downs of the Bitcoin market, it appears that the current cycle is showing a remarkable level of resilience, according to data from Glassnode. This durability is notably evident when comparing the current cycle’s greatest fall, -20.1%, to earlier ones. These data points illuminate market dynamics and Bitcoin’s volatility tolerance.

Glassnode: Bitcoin’s Volatility Seen in Four Major Corrections

By looking at Bitcoin’s price history, some significant key events shaped the cryptocurrency market. The first Bitcoin price was recorded on July 17, 2010. The first Bitcoin halving event, which affected supply and demand, occurred on November 28, 2012. Each of the consecutive halvings on July 9, 2016, and May 30, 2020, affected the market.
By studying trends, Bitcoin’s market performance shows peaks and troughs. On June 8, 2011, the 2011 cycle peaked, then fell on November 18, 2011. In the same fashion, the 2013 cycle peaked on November 30, 2013, and dropped on January 14, 2015. The 2017 cycle peaked on December 17, 2017, and declined on December 16, 2018. Each of these cycles contributes to Bitcoin’s complex history.
Bitcoin ($BTC) has had four major corrections in the current bull market. A 12% drop lasts 12 days, a 22.6% drop lasts 15 days, and two 21% decreases last over 60 days. These adjustments show the bitcoin market’s fragility, emphasizing the need for close monitoring.
Bitcoin’s Resilience Signals Long-Term Growth Potential
The current 12-day 21% fall is a key market factor. This protracted and intense decline shows market sentiment and Bitcoin’s resilience. Market participants seeking to understand crypto must understand these changes.
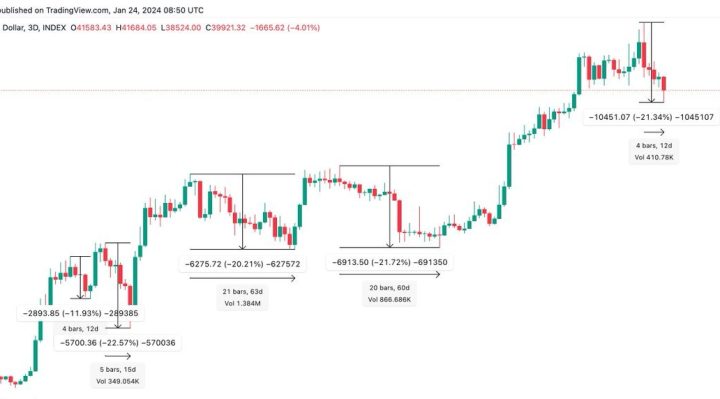
The Bitcoin market cycle has shown durability, with corrections staying within -20.1%. Bitcoin’s 12-day 21% drop complicates its market story. The cryptocurrency sector is always changing, therefore investors and enthusiasts must follow and analyze it. Bitcoin’s durability during market volatility reveals its adaptability and long-term growth potential.