
The price of gold on Friday extended the current monthly gains towards $1,900 before pulling back late on to settle at $1,881. The price of the yellow metal continued the bull-run that goes back to the start of the month when it bottomed at around $1,770.
The gold price remains several levels above the 100-hour and the 200-hour SMA lines. It is pinned centrally in the 14-hour RSI following Friday’s late pullback. It continues to trade above the descending channel formation.
Golf Price Fundamentals Overview

From a fundamental perspective, the yellow metal is trading at a time of increased market optimism amid positive developments around the covid-19 vaccine. The US followed the UK by starting inoculations of the vaccine. This has boosted market optimism with many now seeing a light at the end of a dark covid tunnel.
However, the latest US economic data came out mixed. This boosted the price of the yellow metal in mid-week. The US retail sales control group for November missed the expected change of 0.2% with a change of -0.5%. General retail sales for the period also came short of the (MoM) expectation of -0.3% with a change of -1.1%.
On Thursday, the Philadelphia Fed Manufacturing Survey for December missed the expected reading of 20 with 11.1. The initial jobless claims for the week ending Dec. 11 also came short of 800k with 885k while continuing claims beat 5.598M with 5.508M.
Gold Price Technical Analysis (the 60-min chart)
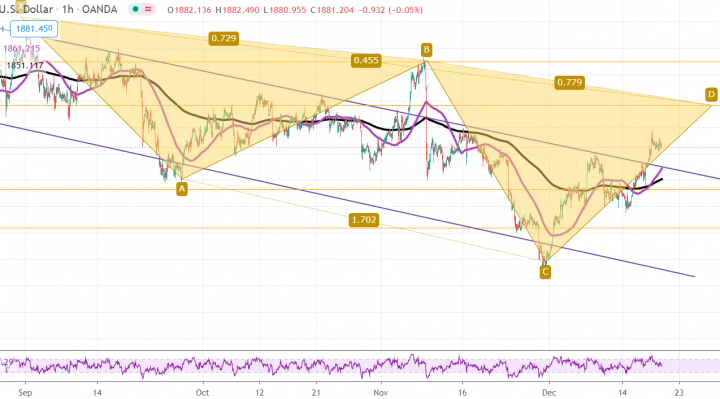
Technically, the price of gold appears to be trading within a bullish curve in the 60-min chart The yellow metal appears to have recently completed a bullish breakout from a descending channel formation. Friday’s late pullback prevented it from ascending to overbought levels of the 14-hour RSI.
The bulls will be looking to extend the current short-term bull-run towards $1,920 or higher to $1,961. On the other hand, the bears will target short-term pullback profits at around $1,841 or lower to $1,804.
Gold Price Technical Analysis (the Daily Chart)
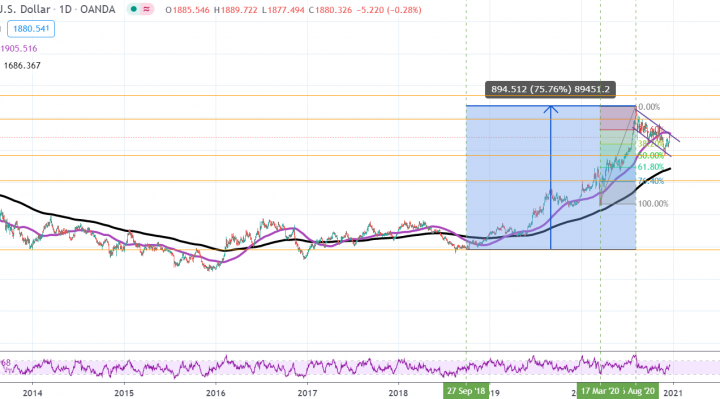
In the daily chart, the price of gold appears to be trading within a descending channel formation. This indicates a significant long-term bearish bias in the market sentiment. It has recently bounced off oversold levels in the 14-day RSI.
The bulls will be looking to ride the current rebound by targeting profits at around $1,992 or higher at $2,141. On the other hand, the bears will target long-term profits at around 50% and 76.40% fib levels at $1,769 and $1,610, respectively.