
The gold price on Friday continued to trade around $1,770 level slightly off weekly highs of $1,778 after a round of positive US spending data. The price of the yellow metal continues to trade within an ascending channel in the 60-min chart. The price of gold has maintained a bullish run for the last two weeks but that now appears to be coming to an end.
The yellow metal continues to trade closer to the 14-hour RSI. This could be the reason behind the lack of upward momentum. It trades slightly above the 100-hour SMA while the 200-hour SMA is more pips lower.
Gold Price Fundamentals Overview

From a fundamental perspective, the price of gold is trading at the back of a relatively busy period in the US market. The XAU/USD has enjoyed a bullish period over the last few weeks, but this week’s data appear to have favored the greenback. On Tuesday, the Markit manufacturing and services PMIs beat the expectations of 48 and 46.5, respectively with 49.6 and 46.7. New homes sales for May and the Richmond Manufacturing Index for June also outperformed estimates.
On Thursday, durable goods orders ex-transportation for May beat the expectation of 2.5% with 4%. The GDP price index for Q1 beat 1.4% with 1.6% while general durable goods orders for May outperformed 10.9% with 15.8%. Core personal expenditures for Q1 beat the (QoQ) expectation of 1.6% with 1.7%. On Friday, the core personal expenditure price index for May beat the (MoM) expectation of 0.0% with 0.1% while personal income outperformed -6% with -4.2%.
Gold Price Technical Analysis (the 60-min Chart)
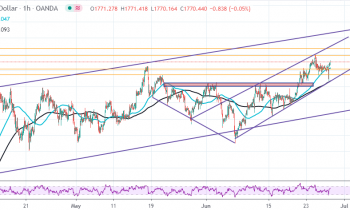
Technically, the price of gold appears to be trading within an ascending channel in the 60-min chart. This indicates a short-term bullish bias in the market sentiment. However, that momentum appears to have faded off over the last few trading sessions.
Therefore, the bears will be targeting short-term pullback profits at around $1,765 or lower at $1,761. On the other hand, the bulls will look to pounce for profits at around $1,778 or higher at $1,787.
Gold Price Technical Analysis (the Daily Chart)

In the daily chart, the price of gold appears to be trading within an ascending channel which dates back to early last year. This indicates a long-term bullish bias in the market sentiment. The gold price is now trading just off its multi-year highs after this week’s pullback.
The bulls will be looking to extend the current gains towards $1,792 or higher to $1,820. On the other hand, the bears will target long-term pullback profits at around $1,747 or lower at $1,720.