
The gold price on Friday fell to retest the current weekly lows of about $2,399 following the latest round of data. The XAU/USD continues to trade within a descending channel formation in the 60-minute chart.
The price of the yellow metal has now plummeted to trade below the 100-hour moving average line. Friday’s decline pushed the gold price deeper into the oversold levels of the 14-hour RSI.
Gold Price Fundamentals Overview

From a fundamental perspective, the yellow metal is trading at the back of a relatively busy period in the US market. On Thursday, the Philadelphia Fed Manufacturing Survey for July outperformed the expectation of 2.9 with a reading of 13.9, up from the previous month’s equivalent of 1.3.
The US initial jobless claims for the week ending July 12 missed the forecasted claim count of 230k with a significantly higher tally of 243k. The continuing claims for the preceding week also fell short of 1.86 million with a slightly higher tally of 1.867 million.
On Wednesday, the US building permits for June beat the expectation of 1.39 million with a tally of 1.446 million. Housing starts for the period also outshone the forecast of 1.31 million with 1.353 million.
Earlier in the week, US retail sales for June matched the forecasted (MoM) change of 0%, compared to a change of 0.3% in the previous month. The retail sales ex-transportation beat 0.1% with a change of 0.4%, up from 0.4%, while the retail sales control group edged higher 0.9% compared to a change of 0.4% in May.
Gold Price Technical Analysis (the 60-min Chart)
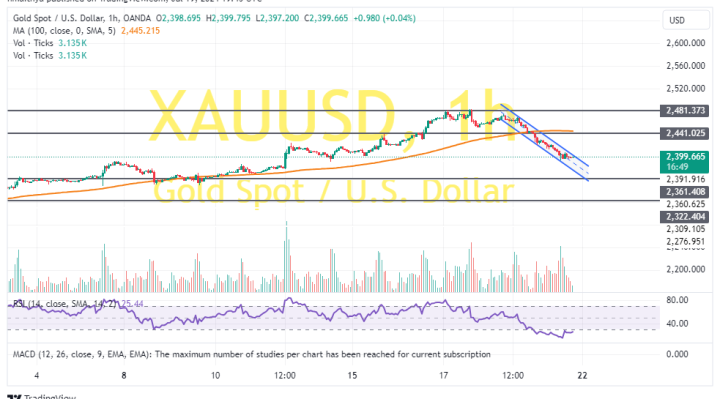
Technically, the XAU/USD trades within a descending channel formation in the 60-minute chart. The 14-hour RSI has also plummeted to trade deep into the oversold levels of the indicator.
Therefore, the bears will be targeting extended declines at about $2,361 or lower at $2,322. On the other hand, the bulls will look to pounce on rebounds at about $2,441 or higher at $2,481.
Gold Price Technical Analysis (the Daily Chart)
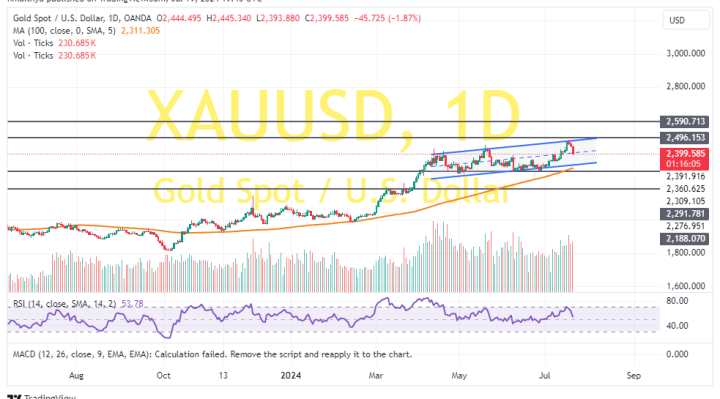
In the daily chart, the yellow metal trades within an ascending channel formation. However, the 14-day RSI has since pulled back to avoid rallying into the overbought levels of the indicators.
Therefore, the bears will be targeting extended pullbacks at about $2,291 or lower at $2,188. On the other hand, the bulls will look to pounce on profits at about $2,496 or higher at $2,590.