
The gold price on Friday extended this week’s declines to a new 2023 low of about $1,819 following the latest round of US data. The price of the yellow metal seems to be trading within a descending channel formation in the 60-min chart.
The XAU/USD continues to trade several levels below the 100-hour moving average line. As a result, the price of the yellow metal seems to be moving closer to the oversold levels of the 14-hour RSI.
Gold Price Fundamentals Overview

From a fundamental perspective, the gold price is trading at the back of a relatively busy period in the US market. On Thursday, the initial jobless claims for the week ending February 17 outperformed the expected claim count of 200k with a lower tally of 192k. The continuing claims for the preceding week also beat 1.7 million with a tally of 1.654 million, while the Chicago Fed National Activity Index for January outperformed the expected reading of 0.03 with a reading of 0.23.
Elsewhere, the preliminary US gross domestic product for Q4 outperformed the expected change of 3.5% with a change of 3.9%. On the other hand, the annualised GDP for the period came short of the forecasted change of 2.9% with a change of 2.7%, while the preliminary personal consumption expenditure prices for the quarter outshone the estimate of 3.2% with a change of 3.7% (QoQ). The core personal consumption expenditures for the quarter also beat the estimate of 3.9% with a change of 4.3% (QoQ).
Gold Price Technical Analysis (the 60-min Chart)
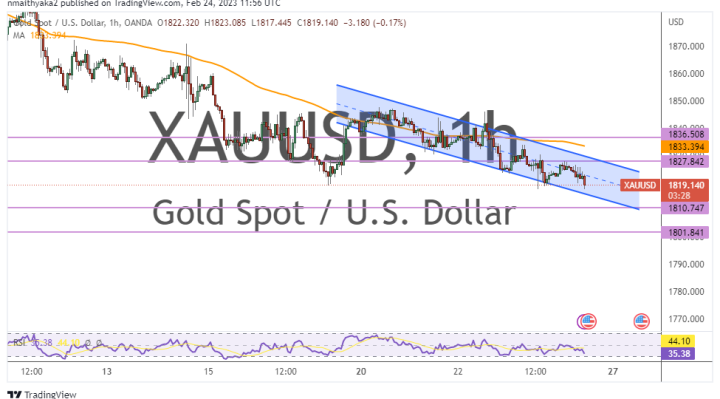
Technically, the price of gold appears to be trading within a descending channel formation in the 60-min chart. This indicates a significant short-term bearish bias in the market sentiment.
Therefore, the bears will be looking to stretch the current run of declines toward $1,810 or lower to $1,801. On the other hand, the bulls will be targeting rebound profits at about $1,827 or higher at $1,836.
Gold Price Technical Analysis (the Daily Chart)
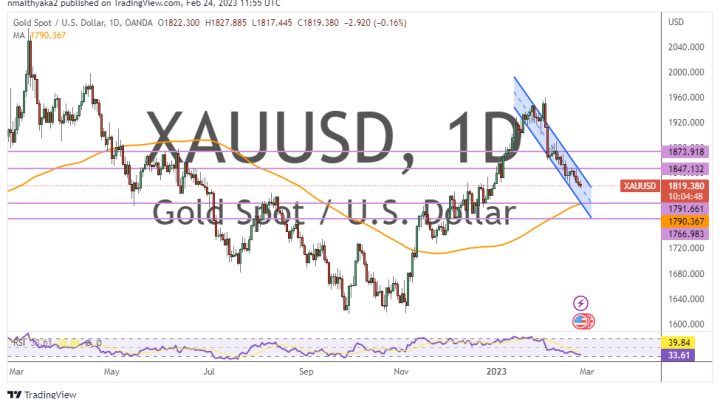
In the daily chart, the price of the yellow metal appears to be trading within a sharply descending channel formation. This indicates a strong long-term bearish bias in the market sentiment.
Therefore, the bears will be targeting long-term profits at about $1,791 or lower at $1,766. On the other hand, the bulls will look to pounce on profits at about $1,847 or higher at $1,873.