
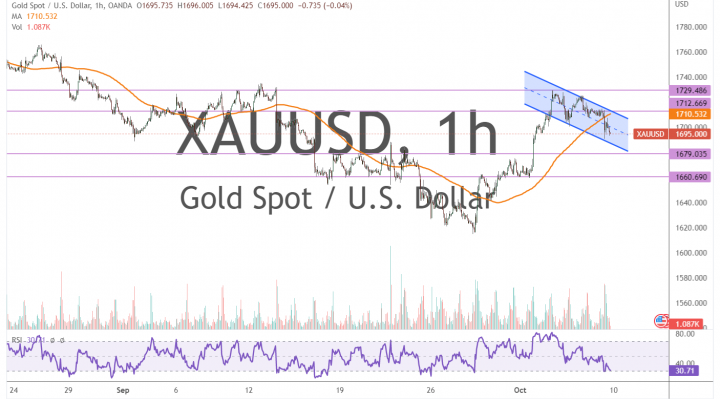
The gold price on Friday extended declines to trade below the 100-hour moving average line after pulling back off current 5-week highs of about $1,730. The price of the yellow metal continues to trade within a descending channel formation in the 60-min chart.
The gold price now appears to have descended to trade closer to the oversold conditions of the 14-hour RSI. As of this writing, the XAU/USD spot traded at about $1,695 an ounce.
Gold Price Fundamentals Overview

From a fundamental perspective, gold is trading at the back of a relatively busy period in the global markets. On Friday, the US Department of Labour Statistics reported 263k non-farm payrolls, compared to an expectation of 250k. On the other hand, the average hourly wage growth fell short of estimates with a change of 5% versus a consensus market forecast of 5.1%, while the unemployment rate edged to the lowest level since July after falling to 3.5%, down from 3.7%. The market was expecting an unchanged rate of 3.7%.
Earlier in the week, the ISM Manufacturing PMI for September missed the expectation of 52.2 with a reading of 50.9. All its associated segments including Prices Paid, Employment Index, and New Orders Index also missed forecasts. However, the S&P Global Manufacturing PMI outperformed the expectation of 5.18 with a reading of 52, while the ADP Employment Change for September beat the forecast of 200k with a job count of 208k on Wednesday.
Gold Price Technical Analysis (the 60-min Chart)
Technically, the price of the yellow metal seems to be trading within a descending channel formation in the 60-min chart. This indicates a significant short-term bullish bias in the market sentiment.
Therefore, the bears will be looking to extend the current run of declines toward $1,679 or lower to $1,660. On the other hand, the bulls will be targeting short-term profits at about $1,712 or higher at $1,729.
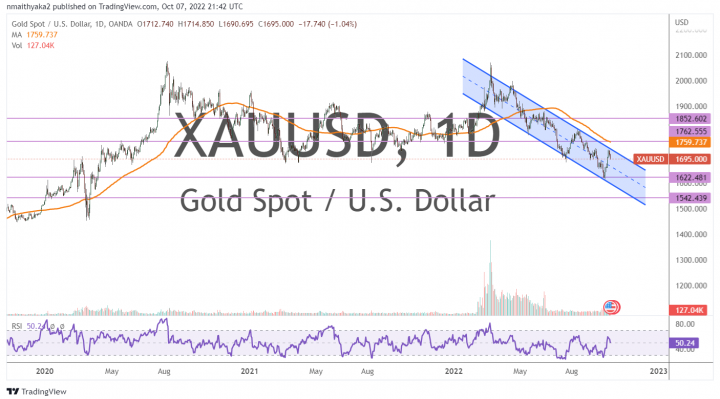
Gold Price Technical Analysis (the Daily Chart)
In the daily chart, the gold price seems to be trading within a descending channel formation. This indicates a significant long-term bearish bias in the market sentiment.
Therefore, the bulls will be targeting potential rebounds at about $1,762 or higher at $1,852. On the other hand, the bears will be targeting long-term profits at about $1,622 or lower at $1,542.