
The price of gold continued with its mid-week gains towards $1,880 following Tuesday’s late rebound. The price of the yellow metal retains a bullish outlook despite Monday’s pullback. It has now rallied to trade closer to overbought levels of the 14-hour RSI in the 60-min chart.
The gold price continues to trade within an ascending channel formation, which indicates a short-term bullish bias. It is pinned just above the 100-hour SMA while the 200-hour counterpart is a few levels below.
Gold Price Fundamentals Overview

From a fundamental perspective, the price of gold is trading at a time of limited market activity amid the Christmas holiday celebrations. Earlier this week, the US gross domestic product for Q3 beat the (YoY) expectation of 33.1% with a change of 33.4%. The (QoQ) figure also outperformed the expectation of -2% with a change of 3.7%. On Wednesday, the US core personal consumption expenditure price index for November missed the expected (MoM) change of 0.1% with a change of 0.0%. The (YoY) equivalent also came short of 1.5% with 1.4%.
Durable goods orders for November beat the expected change of 0.6% with a change of 0.9% while nondefense capital goods orders ex-aircraft missed 0.6% with 0.4%. The initial jobless claims for the week ending December 18 beat the expected claim count of 885k with a tally of 803k claims. On the other hand, continuing claims for the preceding week outperformed 5.558M with a claim count of 5.337M. Personal income and personal spending for November also missed estimates.
Gold Price Technical Analysis (the 60-min Chart)
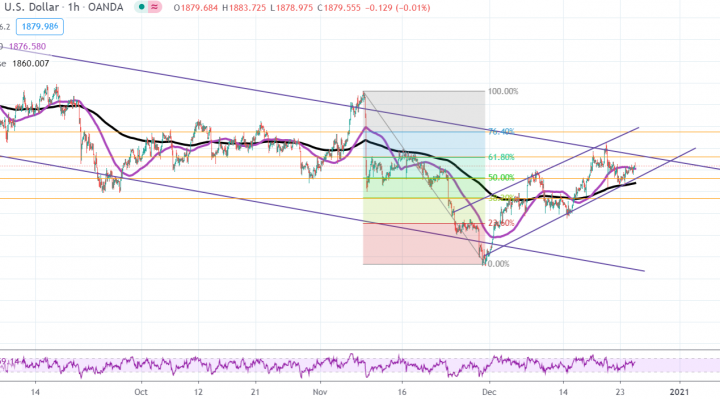
Technically, the price of gold appears to be trading within an ascending channel formation in the 60-min chart. This indicates a significant short-term bullish bias in the market sentiment. The channel is forming off a descending channel, which indicates an attempt by the bulls to trigger a reversal.
The bulls will be targeting short-term profits at around 61.80% and 76.40% Fib levels at $1,889 and $1,918, respectively. On the other hand, the bears will target pullbacks at 50% and 38.20% fib levels at $1,865 and $1,842, respectively.
Gold Price Technical Analysis (the Daily Chart)
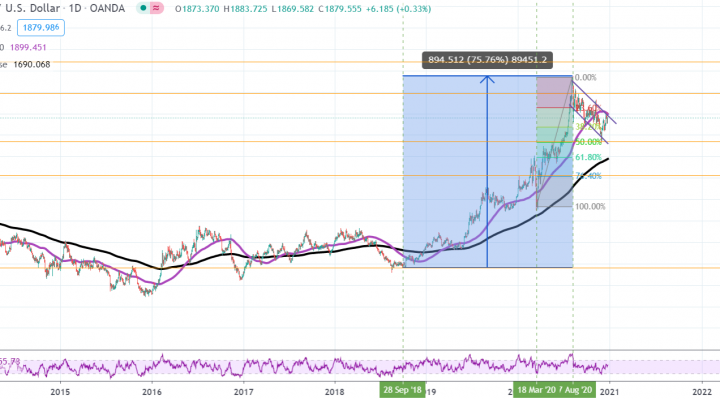
In the daily chart, the price of the yellow metal appears to be trading within a descending channel formation. This indicates a significant long-term bearish bias in the market sentiment. It has moved closer to the overbought levels of the 14-day RSI.
The bulls will be targeting long-term profits at around $1,992 or higher to $2,141. On the other hand, the bears will look to pounce for long-term profits at around 50% and 76.40% Fib levels at $1,769 and $1,610, respectively.