
The gold price on Friday extended pullbacks off session highs of about $2,187 to trade at about $2,165. The XAU/USD appears to be trading within a descending channel formation in the 60-minute chart.
The gold price has now plummeted to trade slightly below the 100-hour moving average line. As a result, the yellow metal appears to be moving closer to the oversold levels of the 14-hour RSI.
Gold Price Fundamentals Overview

From a fundamental perspective, the yellow metal is trading at the back of a relatively busy period in the US market. On Thursday, the US initial jobless claims for the week ending March 15 outperformed the expectation of 215k with a relatively lower tally of 210k.
The Philadelphia Fed Manufacturing Survey for March also exceeded the estimate of -2.3 with a reading of 3.2, down from the previous month’s equivalent of 5.2. The preliminary S&P Global Manufacturing PMI for March also beat the forecast of 51.7 with a reading of 52.5, while the Services PMI for the period missed the estimate of 52 with a reading of 51.7.
Earlier in the week, the Federal Reserve voted to keep the base interest rate pegged at 5.25%-5.5%, in line with expectations. The building permits for February exceeded expectations of 1.495 million with 1.518 million, while housing starts for the period beat 1.425 million with a tally of 1.521 million.
Gold Price Technical Analysis (the 60-min Chart)
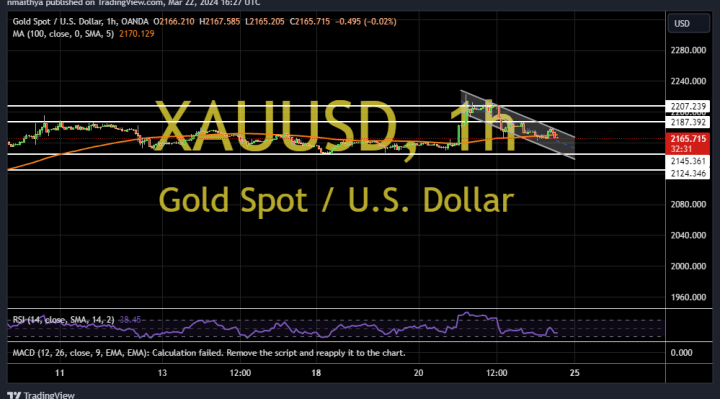
Technically, the price of the yellow metal appears to be trading within a descending channel formation in the 60-min chart. The 14-hour RSI also appears to support a short-term bearish bias as it moves closer to oversold conditions.
Therefore, the bears will be looking to pounce on extended declines at about $2,145 or lower at $2,124. On the other hand, the bulls will be targeting potential rebounds at about $2,187 or higher at $2,207.
Gold Price Technical Analysis (the Daily Chart)
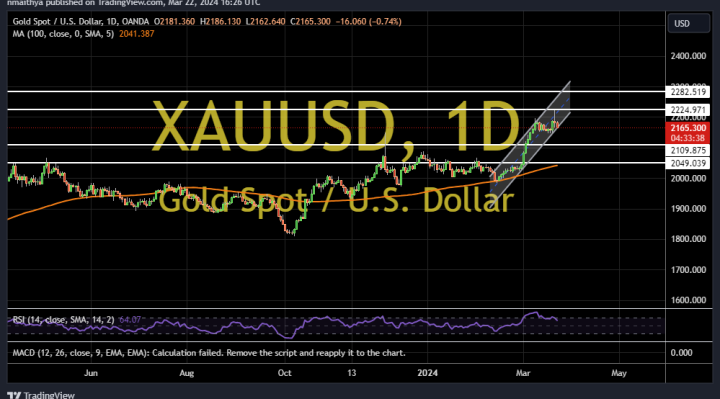
In the daily chart, the price of gold appears to be trading within an ascending channel formation. However, the 14-day RSI has recently pulled back to recover from overbought conditions.
Therefore, the bears will be targeting extended pullbacks at about $2,109 or lower at $2,049. On the other hand, the bulls will look to pounce on profits at about $2,224 or higher at $2,282.