
The gold price on Thursday extended Wednesday’s sharp spike to breath below the $1,800 level after bouncing off the 100-hour MA. The price of the yellow metal continues to oscillate within an ascending channel formation in the 60-min chart.
The gold price is now pinned several levels above the 100-hour moving average. As a result, the XAU/USD has rallied closer to the overbought conditions of the 14-hour RSI. This triggered a slight pullback late on Thursday.
Gold Price Fundamentals Overview

From a fundamental perspective, gold is trading at the back of a relatively busy period in the US market. The price of the yellow metal received a boost on Wednesday after the US consumer price index came in slightly stronger than expected with a (YoY) change of 5.4% compared to the estimate of 5.3%. The (MoM) equivalent also outperformed the estimate of 0.3% with 0.4%. On the other hand, the CPI ex-food and energy matched the (YoY) expectation of 4% and 0.2% (MoM).
On Thursday, the US initial jobless claims further boosted the yellow metal price after coming in lower than expected with 293k claims versus 319k, while continuing claims also impressed with 2.593 million versus 2.675 million. On the other hand, the producer price index ex-food energy for September missed the expectation of 7.1% with a (YoY) change of 6.8%. The (MoM) equivalent also came short of 0.5% with 0.2%. The general PPI for the period also missed both the (YoY) and (MoM) forecasts.
Gold Price Technical Analysis (the 60-min Chart)
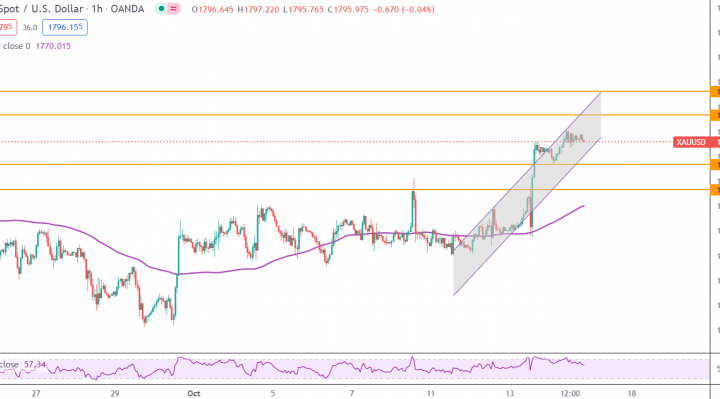
Technically, the XAU/USD seems to be trading within a sharply ascending channel formation in the 60-min chart. This indicates a significant short-term bullish bias in the market sentiment.
Therefore, the bulls could be targeting extended short-term gains at about $1,806 or higher at $1,816. On the other hand, the bears will target potential pullback profits at about $1,786 or lower at $1,776.
Gold Price Technical Analysis (the Daily Chart)
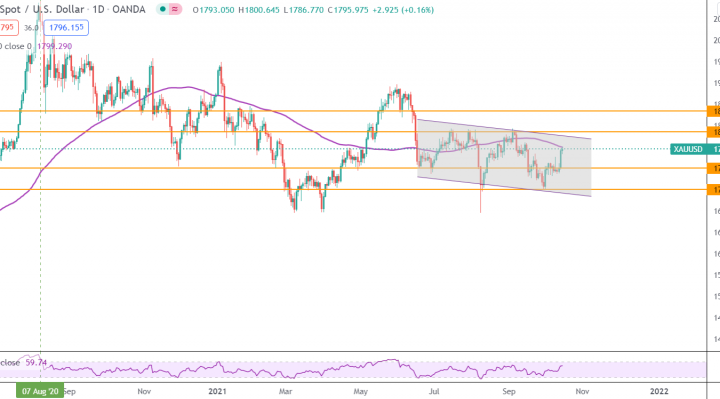
In the daily chart, the gold price seems to be trading within a gently descending channel formation. However, the price of the yellow metal recently spiked to surge towards overbought conditions.
Therefore, the bulls will be looking to ride the current rebound towards $1,828 or higher to $1,866. On the other hand, the bears will target long-term profits at about $1,760 or lower at $1,720.