
The gold price on Thursday bounced off the key support at about $1,955 before rallying towards the key resistance level of $1,980. The XAU/USD appears to have found strong resistance within an ascending channel formation.
Gold still remains several levels above the 100-hour moving average line. As a result, the price of the yellow metal seems to be edging closer to the overbought levels of the 14-hour RSI.
Gold Price Fundamentals Overview

From a fundamental perspective, the price of yellow metal is trading at the back of a relatively busy period in the US market. On Thursday, the ADP employment change for May beat the expected job count of 170k with a tally of 278k. On the other hand, the ISM Manufacturing PMI for the month missed the expected reading of 47 with a reading of 46.9.
The ISM Manufacturing Prices Paid and New Order Index also missed 52 with 44.2 and 44.9 with 42.6, respectively. The ISM Manufacturing Employment Index beat the forecasted reading of 49.8 with a reading of 51.4, while the initial jobless claims for last week outperformed the expected claim count of 235k with a slightly lower tally of 232k.
Earlier in the week, the Housing Price Index for March beat the expected (MoM) change of 0.2% with a change of 0.6%, while the S&P/Case-Shiller Home Price Indices for the month beat the expected (YoY) change of -1.6% with a change of -1.1%. Looking forward, traders will be waiting for Friday’s nonfarm payrolls.
Gold Price Technical Analysis (the 60-min Chart)
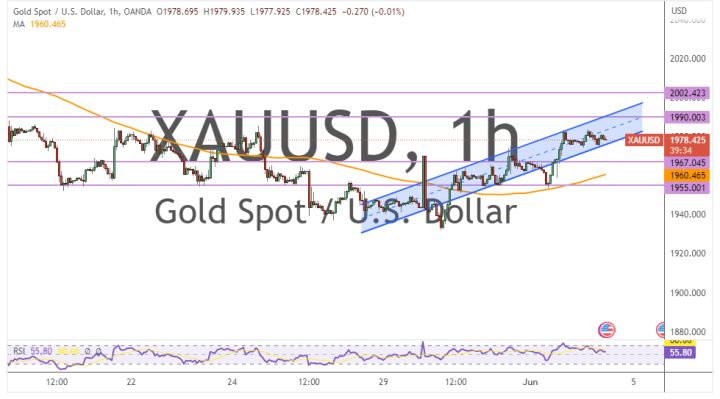
Technically, the price of gold seems to be trading within an ascending channel formation in the 60-min chart. This indicates a significant short-term bullish bias in the market sentiment.
Therefore, the bulls will be looking to stretch the current run of gains toward $1,990 or higher to $2,002. On the other hand, the bears will be targeting profits at about $1,967 or lower at $1,955.
Gold Price Technical Analysis (the Daily Chart)
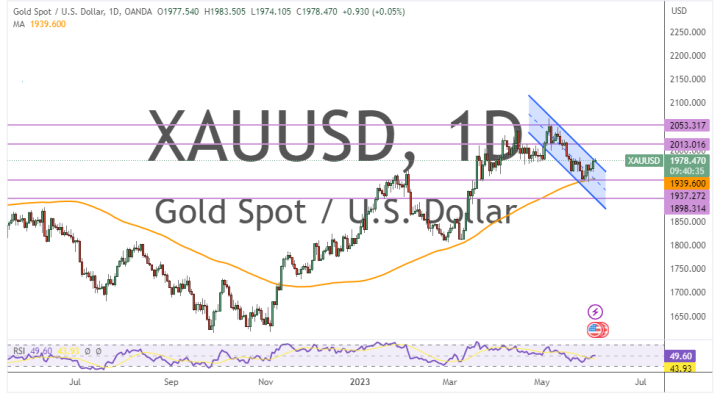
In the daily chart, the XAU/USD seems to be trading within a descending channel formation. This indicates a significant long-term bearish bias in the market sentiment.
Therefore, the bulls will be targeting potential rebounds at about $2,013 or higher at $2,053. On the other hand, the bears will be targeting long-term profits at about $1,937 or lower at $1,898.