
The gold price on Thursday bounced off the 100-hour moving average line to halt the decline after plunging from the current monthly highs earlier in the day. The XAU/USD had rallied to trade at around the $1,980 level before the pullback.
The price of the yellow metal continues to oscillate within an ascending channel formation in the 60-min chart. The rebound prevented it from declining further toward the oversold levels of the 14-hour RSI.
Gold Price Fundamentals Overview

From a fundamental perspective, gold is trading at the back of a relatively busy period in the US market. On Thursday, the US retail sales control group for March missed the expected change of 0.2% with a change of -0.1%. General retail sales for the period also came short of 0.6% with a change of 0.5% (MoM).
On the other hand, retail sales ex-autos outperformed 1% with 1.1% (MoM). Elsewhere, the import and export price indexes for March both beat on a (YoY) and (MoM) basis, while the initial jobless claims for last week missed the expected claim count of 171k with a higher tally of 185k.
Earlier in the week, the producer price index ex-food and energy for March outperformed both the (MoM) expectations and the (YoY) estimates. On the other hand, the consumer price index ex-food and energy missed on both counts.
Gold Price Technical Analysis (the 60-min Chart)
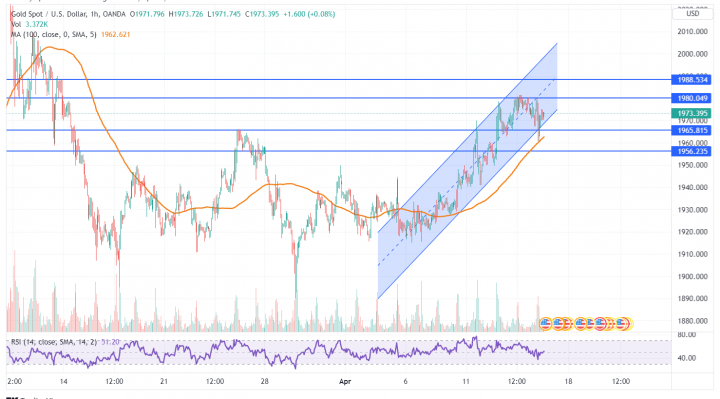
Technically, the gold price seems to be trading within an ascending channel formation in the 60-min chart. This indicates a significant short-term bullish bias in the market sentiment.
Therefore, the bulls will be looking to extend the current gains towards $1,980 or higher to $1,988. On the other hand, the bears will be targeting potential pullback profits at about $1,965, or lower at $1,956.
Gold Price Technical Analysis (the Daily Chart)
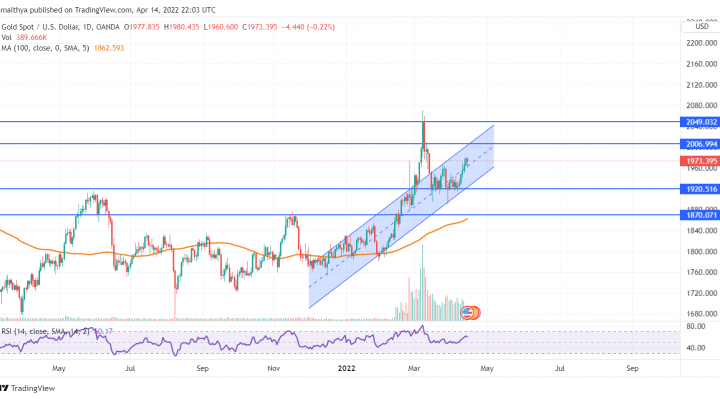
In the daily chart, the gold price seems to have recently bounced back to recover from a sharp pullback. The price of the yellow metal has now resumed its previous upward trending channel, implying a long-term bullish bias.
Therefore, the bulls will be targeting long-term profits at about $2,006, or higher at 2,049. On the other hand, the bears will be looking to pounce on long-term reversals at about $1,920, or lower at $1,870.