
The gold price on Friday bounced off the 100-hour moving average to trade at about $1,717 after pulling back off $1,726. The price of the yellow metal continues to trade within a gently ascending channel formation in the 60-min chart.
The gold price has now advanced to trade slightly above the 100-hour MA. However, Friday’s pullback prevented the XAU/USD from ascending deep into the overbought levels of the 14-hour RSI.
Gold Price Fundamentals Overview

From a fundamental perspective, the XAU/USD is trading at the back of a relatively busy period in the global markets. On Thursday, the European Central Bank raised the base interest rate to 1.25% up from 0.5%. The base deposit rate is also up by 75 basis points to 0.75%. On Friday, the Bank of Canada followed the same with a 75 basis point hike, to 3.25% up from 2.5%.
Elsewhere, in the US the growing market optimism continued to affect the price of the yellow metal after the ISM Services PMI outperformed the expectation of 55.1 with 56.9. The ISM Services Employment Index and New Orders Index both outshone expectations while Prices Paid failed to meet estimates. The S&P Global Services PMI and the S&P Global Composite PMI also fell short of expectations.
Gold Price Technical Analysis (the 60-min Chart)
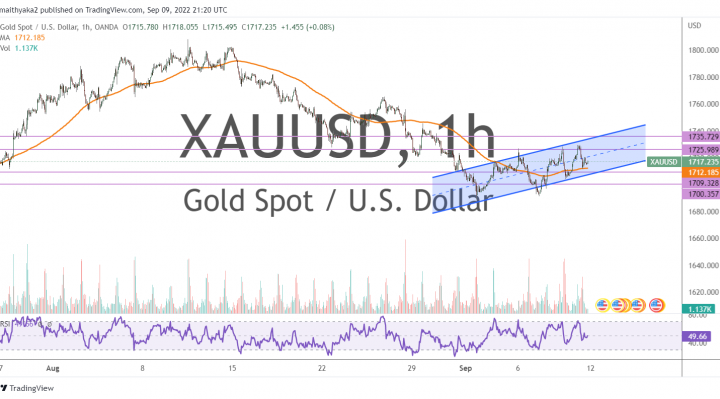
Technically, the gold price seems to be trading within a gently ascending channel formation in the 60-min chart. This indicates a significant short-term bullish bias in the market sentiment.
Therefore, the bulls will be targeting short-term rebound profits at about $1,725 or higher at $1,735. On the other hand, the bears will look to pounce on extended pullbacks at about $1,709 or lower at $1,700.
Gold Price Technical Analysis (the Daily Chart)
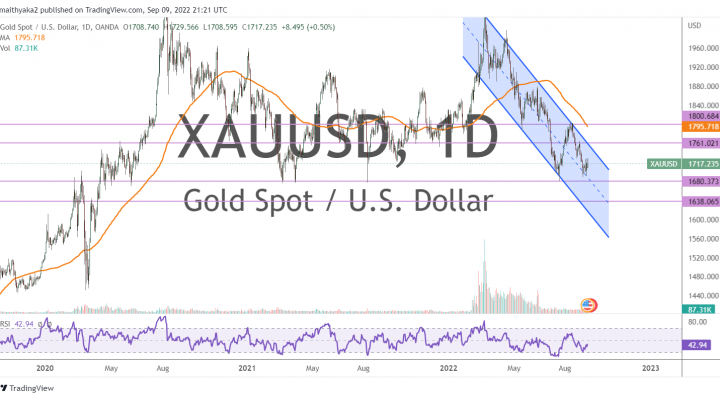
In the daily chart, the price of the yellow metal seems to be trading within a descending channel formation. This indicates a significant long-term bearish bias in the market sentiment.
Therefore, the bears will be looking to stretch the current streak of declines toward $1,680 or lower to $1,638. On the other hand, the bulls will look to pounce on profits at about $1,761 or higher at $1,800.