
Gold’s record high
Gold price’s bull run has started since November 2022 and might be nearing the end of bullish leg. The price continue the bullish trend and continuously print new record high this year. There were two bearish months, but the price has erased all the losses. At the current time, the price has reached a new record high and expected to continue its upward grind. Traders who has long positions will continue to ride the rally and accumulate long positions when a bearish correction happens.
New Month
Monthly Chart


Gold almost reached the Fibonacci extension level, which could be the place where a bearish reaction happen. Whoever, the price could also continue moving bullishly without any major bearish pullback. Traders will avoid shorting gold prices and wait for bearish pullback to add more long positions. If a bearish pullback happens, $2,720 is the nearest level to watch as support level.
Weekly Chart
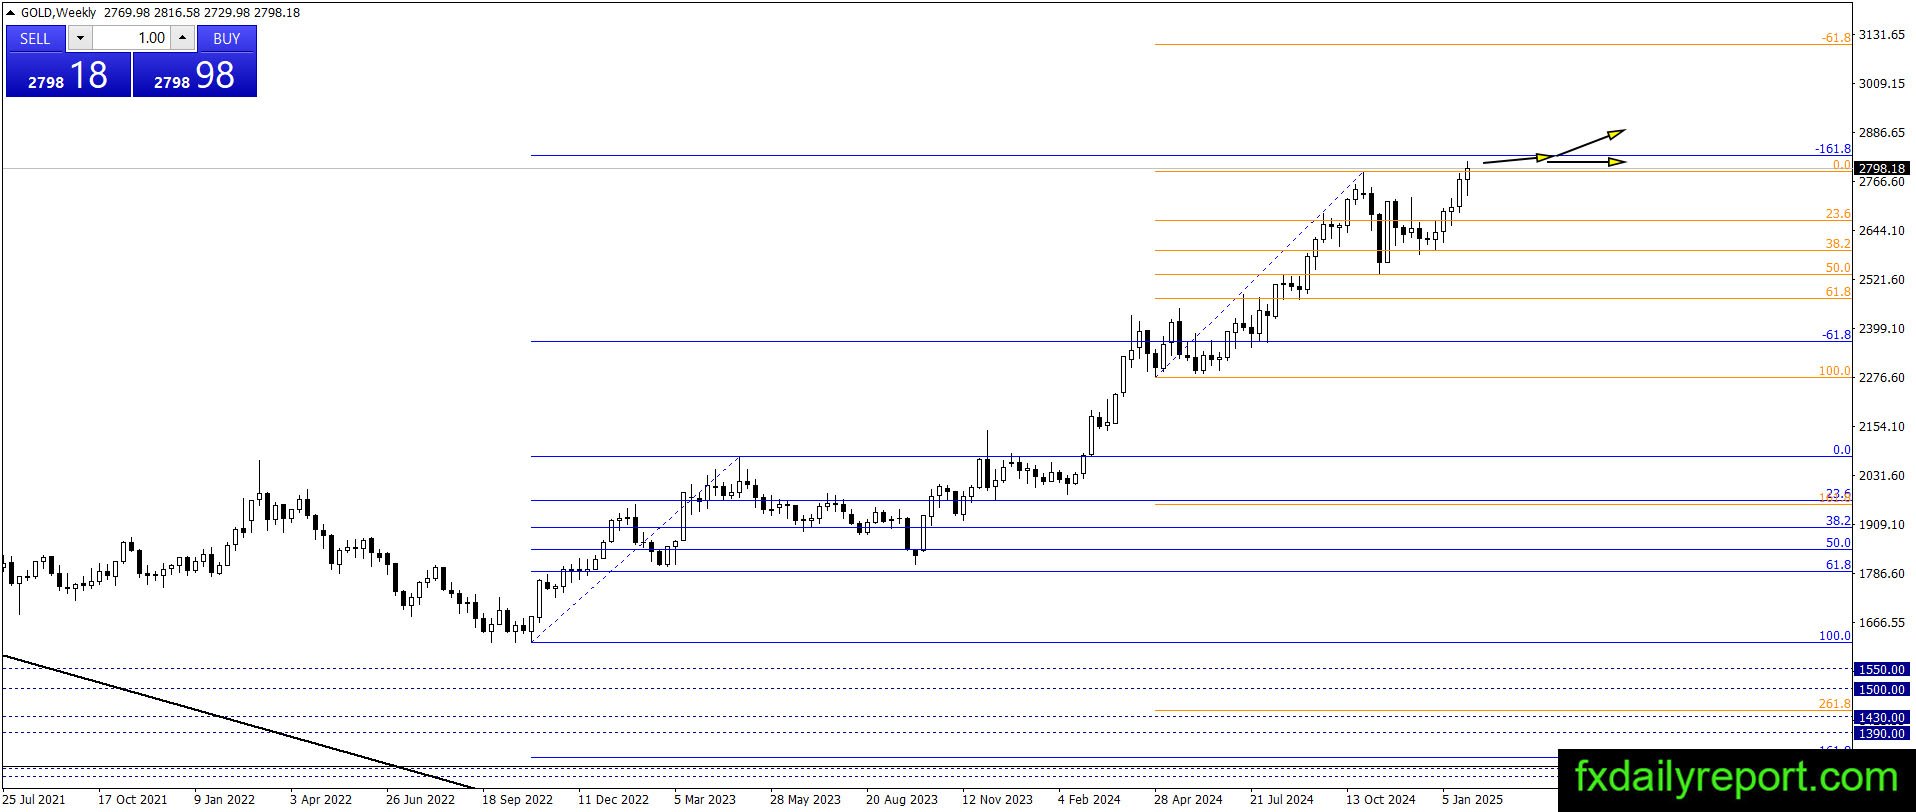
The price situation on the weekly chart also shows strong bullish trend. A bearish pullback has happened, and there were bounce reactions from the 50% Fibonacci Retracement level. The price is resuming the bullish trend and reached a new record high. The same as monthly chart situation, it is better to hold long positions and wait for bearish pullback to add more long positions.
Daily Chart

On the daily chart, we could see the price broke above $2,720, made a bearish pullback which did not reach the level and resume the bullish trend. If the price made another bearish correction, then $2,720 and the trend line will become support levels to watch. Traders will wait for bounce reactions to add more long positions.
Trade Plan
There is no bearish sign yet on the gold prices. The only way for the bear to seize control is to bring the price lower below the bullish trend line on the daily chart. $2,720 is the nearest support level to watch. Traders could wait near the $2,720 level or the trend line for bullish reactions. When there are bullish reactions, traders could enter long positions. Stop level could be placed below the trend line or latest swing low around $2,580 – $2,600.