
The price of gold (XAU/USD) on Friday extended the current yearly gains to $1,553, just a few paces off the current multi-year highs before pulling back below $1,550 late on. The price of the yellow metal has been on a bullish run since the final week of December and does not look like slowing down amid a growing global economic uncertainty.
The gold price traded at about $1,480 on December 22 but has since surged to trade at new multi-month highs as and close enough to flirt with the current multi-year highs of about $1,557.
Gold Price Fundamentals Overview

From a fundamental perspective, the price of the yellow metal has thrived due to a lack of key economic data to support high-risk capital investments during the holiday season. The few economic data that was released during the last two weeks were relatively mixed offering no appetite for optimism in the equities market.
Earlier this week, China’s non-Manufacturing PMI for December narrowly missed the expectation of 53.6 with 53.5 while the counterpart NBS Manufacturing PMI beat 50.1 with 50.2. However, the all-important Caixin Manufacturing PMI came short of the consensus estimate of 51.7 with 51.5.
The Markit Manufacturing PMI was mixed across Europe with Spain, France, Germany, and the EU block beating expectations while Italy and the UK came short. Both Canada’s and the US Markit Manufacturing PMIs also missed expectations. But the most killer for the US economic prospects came on Friday when the all-important ISM Manufacturing PMI posted a reading of 47.2 versus an expectation of 49, down from 48.1 in the previous month.
Gold Price Technical Analysis (the 60-min Chart)
Technically, the price of gold appears to be trading under intense buying pressure, which indicates a short-term bullish bias in the market sentiment. The gold price is now trading within the overbought levels of the RSI indicator in the 60-min chart, which again supports the short-term bullish case.
Therefore, the bulls will hope to carry on this momentum into next week by targeting short-term profits at around $1,553 or higher at $1,557. On the other hand, the bears will hope for a quick pullback towards $1,543 or lower at $1,537.
Gold Price Technical Analysis (the Daily Chart)
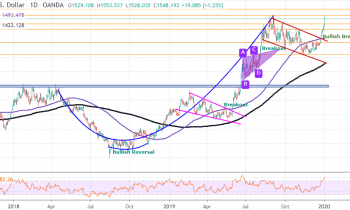
In the daily chart, the price of the yellow metal appears to have recently made a bullish breakout from a descending channel, which supports a long-term bullish bias in the market sentiment. The gold price has also hit overbought levels of the RSI in the daily chart and this could trigger a pullback early next week.
Therefore, the bears will target pullback profits at around $1,533, $1,517 or lower at $1,481. On the other hand, the bulls will hope to retain control by targeting profits at around $1,557 or higher at $1,574.