
The gold price on Friday pulled back slightly to trade at about $1,915 following the latest round of US data. The price of the yellow metal appears to be trading within a sideways channel formation in the 60-min chart.
The XAU/USD continues to trade slightly above the 1000-hour moving average line. As a result, the gold price still has a lot of room left to run before reaching the oversold levels of the 14-hour RSI.
Gold Price Fundamentals Overview

From a fundamental perspective, the yellow metal is trading at the back of a relatively busy period in the US market. On Friday, the Michigan Consumer Sentiment Index for August missed the expectation of 71.2 with a reading of 69.5. The UoM 5-year consumer inflation expectations for the month outperformed the expected rate of 2.9% with a rate of 3%. On Thursday, the initial jobless claims for the week ending August 18 outshone the forecasted claim count of 240k with a tally of 230k.
Elsewhere, the durable goods orders for July missed the expectation of -4% with a change of -5.2%. The durable goods orders ex-transportation beat the expected change of 0.2% with a change of 0.5%, while the nondefence capital goods orders ex-aircraft matched the estimated change of 0.1%. Earlier in the week, the preliminary S&P Global Manufacturing, Services and Composite PMIs all fell short of expectations.
Gold Price Technical Analysis (the 60-min Chart)
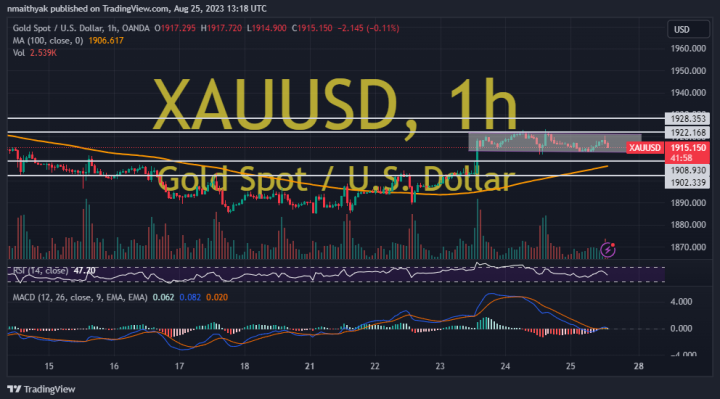
Technically, the price of gold appears to be trading within a sideways channel formation in the 60-min chart. The 1-hour MACD appears to indicate a lack of a clear directional bias in the market sentiment.
Therefore, the bears will be targeting potential downward movement at about $1,908 or lower at $1,902. On the other hand, the bulls will look to pounce on rebounds at about $1,922 or higher at $1,928.
Gold Price Technical Analysis (the Daily Chart)
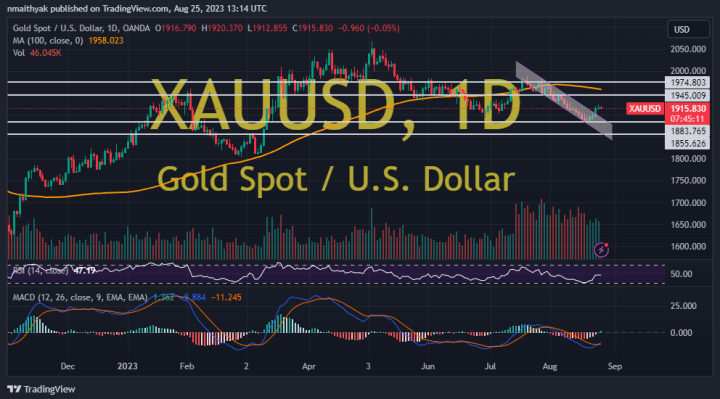
In the daily chart, the XAU/USD appears to have recently completed an upward breakout from a descending channel formation. The MACD also seems to be about to make an upward crossover indicating a change in the market sentiment from bearish to bullish.
Therefore, the bulls will be looking to stretch the current rebound towards $1,945 or higher to $1,974. On the other hand, the bears will be targeting long-term profits at about $1,883 or lower at $1,855.