
The price of gold (XAU/USD) on Thursday found strong support at around $1,460 after pulling back off weekly highs of about $1,478 amid mixed US data. The price fo the yellow metal has been trading in a sideways channel for the better part of the last two weeks and recently bottomed at a new 4-month low of $1,447.
The gold price now appears to be holding firm above the current weekly lows of about $1,457 and this supports the XAU/USD’s current consolidative pattern formation.
Gold Price Fundamentals Overview

From a fundamental perspective, the price of the yellow metal appears to be driven by small bits of positivity in the global economy. The leading economic drivers, including the US and China, have created some little bits of uncertainty after renewed tensions on trade talks. However, while Friday’s economic data disappointed, the latest round of US data beat expectations while the EIA report also surprised.
Furthermore, the latest earnings reports have been positive so far and this has resulted in a significant rise in equity prices with a cloud of optimism circling. Tensions surrounding the Brexit also appear to have cooled recently, which is part of the reason why optimism has returned to the Uk and the EU.
Nonetheless, after the US initial and continuing jobless claims missed expectations on Thursday, there is still a shadow of doubt on how promising the US economy is going into the tail-end of the year. This could explain why the price of gold is holding firm just above $1,460.
Gold Price Technical Analysis (the 60-min Chart)
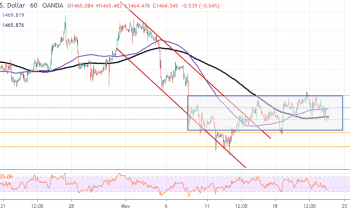
Technically, the price of gold appears to be trading in a sideways channel and this indicates a short-term lack of clear direction amid a renewed market optimism and a series of mixed economic data. The gold price appears to be headed towards oversold levels of the RSI indicator following Thursday’s pullback but lacks the momentum to take it to those levels quicker.
Therefore, the bears will be targeting short-term profits at around $1,457 or lower at $1,450 while the bulls will hope for an immediate rebound towards $1,470 or higher at $1,476.
Gold Price Technical Analysis (the Daily Chart)
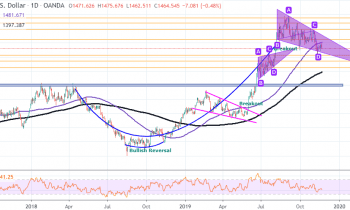
In the daily chart, the price of the yellow metal appears to have recently peaked at $1,447. Since then, the XAU/USD has continued to slide shedding nearly $100 based on the current price of $1,464 per ounce.
The price of the yellow metal is now pegged just below the 100-day SMA, which could provide some short-term bearish pressure while the 200-day SAM down below provides support. The bulls will target long-term profits at around $1,518 while the bears will be looking at $1,410.