
The gold price on Friday pulled back off the 100-hour moving average to trade below $1,790 following the latest round of the US data. The price of the yellow metal continues to trade within a descending channel formation after performing a reversal earlier in the week.
The gold price has failed to break above the 100-hour MA after falling below. However, it is yet to cross to the oversold conditions of the 14-hour RSI. Therefore, it could extend declines in the coming days.
Gold Price Fundamentals Overview

From a fundamental perspective, the yellow metal is trading at the back of a relatively busy period in the US markets. Last week’s US Jobs Data was relatively disappointing with the non-farm payrolls and the ADP employment change for August both missing expectations. On the other hand, the Services and Manufacturing PMIs outperformed estimates. However, this week has quieted with no significant developments apart from the initial jobless claims data and the producer price index ex-food and energy, both of which outperformed expectations.
Therefore, the market has had little to rely on apart from last week’s events. As a result, the gold price has pulled back from last week’s gains made against a mixed bag of US data. Investors will be monitoring the response to the challenges created by the delta variant for more market insight going into next week.
Gold Price Technical Analysis (the 60-min Chart)
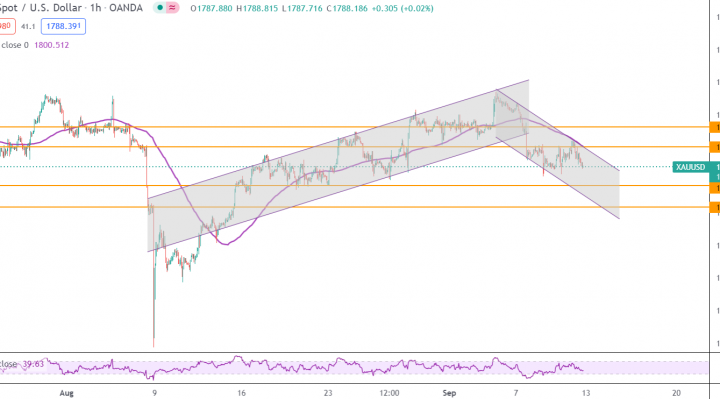
Technically, the gold price seems to be trading within a descending channel formation in the 60-min chart. It has recently pulled back to form a reversal from an ascending trend, pushing the XAU/USD closer to oversold conditions of the 14-hour RSI.
Therefore, the bears will be looking to extend the current declines towards $1,776 or lower to $1,763. On the other hand, the bulls will target potential short-term rebounds at $1,800 or higher at $1,812.
Gold Price Technical Analysis (the Daily Chart)
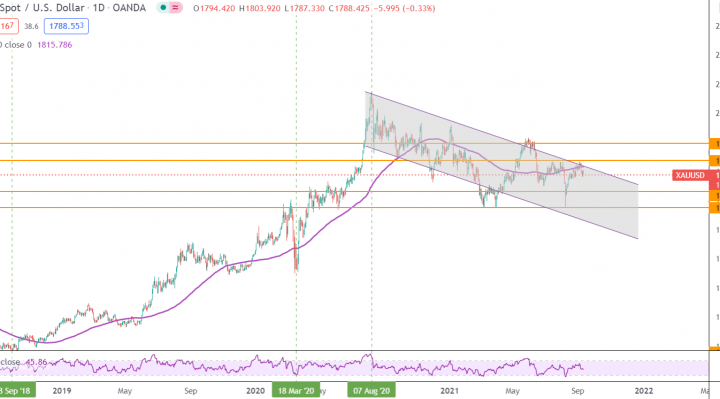
In the daily chart, the XAU/USD seems to be trading within a downward trending channel formation. The gold price has recently pulled back to avoid crossing to the overbought levels of the 14-day RSI.
Therefore, the bulls will be targeting long-term profits at around $1,837 or higher at $1,896. On the other hand, the bears will look to extend the current pullback towards $1,731 or lower to $1,675.