
The gold price on Friday rallied to hit a new multi-year high of $1,752 before pulling back late on to close at $1,742 after the latest US CPI data. The price of the yellow metal broke out of what appears to be a consolidative triangle formation to surge towards the $1,750 key level. The late pullback pulled the gold price off overbought levels of the 14-hour RSI in the 60-min chart. The price of gold has also surged well above the 100-hour and the 200-hour SMA lines.
Gold Price Fundamentals Overview
Globally, the coronavirus pandemic continues to drive demand for safe-haven investments. There is an acceptance that a post-COVID-19 global financial crisis cannot be avoided amid country lockdowns, which have halted the business activity. As such, the price of gold has gained from this realization with many investors looking to cushion their investments in high-risk assets by leveraging with gold investments. The global economic activity led by the US also appears to be slowing down.

On Tuesday, the US Consumer Price Index ex-food and energy missed the (MoM) expectation of -0.2% with -0.4%. The (YoY) reading of 1.4% was also below the expectation of 1.7%. On Thursday, the US initial jobless claims for the week ended May 8 missed the expectation of 2.5 million claims with 2.981M. And on Friday, the US Retail Sales Control Group posted a change of -15.3%, which was massively worse than the market expectation of -4.6%.
Gold Price Technical Analysis (the 60-min Chart)
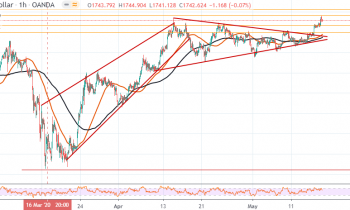
Technically, the gold price appears to have recently made a bullish breakout off a consolidative triangle formation. The price of the yellow metal also appears to be trading very close to overbought levels of the 14-hour RSI in the 60-min chart. This could push the XAU/USD lower in the coming days.
The bears will be targeting pullback profits at around $1,733 or lower at $1,720. On the other hand, the bulls will be targeting profits at around $1,752 or higher at $1,764.
Gold Price Technical Analysis (the Daily Chart)
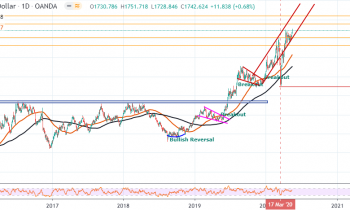
In the daily chart, the price of the yellow metal appears to be trading within a sharply rising channel. This indicates a long-term bullish bias in the market sentiment. The gold price also appears to be approaching overbought levels of the 14-day RSI in the daily chart.
The bulls will be looking to extend long-term gains towards $1,777 or higher at $1,821. On the other hand, the bears will target pullback profits at around $1,708 or lower at $1,665.