
On Friday, the gold price pulled back from the session highs of about $4,660 to trade at about $4,615 after the latest US data. The XAU/USD trades within an ascending channel formation in the 60-minute chart.
The price of the yellow metal continues to trade slightly above the 100-hour moving average line, despite the latest pullback. As a result, it still has plenty of room left to run before reaching the oversold levels of the 14-hour RSI.
Gold Price Fundamentals Overview

From a fundamental perspective, the XAU/USD trades during a relatively busy period in the US market. On Friday, the ISM Manufacturing PMI for April missed the expected reading of 53, with a reading of 52.7, unchanged from the preceding month. On the other hand, the ISM Manufacturing Prices Paid for the month beat 80, with a reading of 84.6, up from 78.3, while the ISM Manufacturing Employment Index missed 49, with a reading of 46.4, down from 48.7.
On Thursday, the preliminary annualized US gross domestic product for Q1 missed the expectation of 2.3%, with a change of 2%. The preliminary gross domestic product price index for the period also fell short of 3.8%, with a change of 3.6%.
On the other hand, the Chicago Purchasing Managers’ Index for April fell short of the forecasted reading of 53, with a reading of 49.2, down from 52.8 in March. The initial jobless claims for last week came in better than expected, with 189k versus a forecast of 215k, down from the previous week’s claim count of 215k.
Elsewhere, personal income for March outperformed the expected (MoM) change of 0.3%, with a change of 0.6%, while personal spending matched the forecasted change of 0.9%.
Gold Price Technical Analysis (the 60-min Chart)
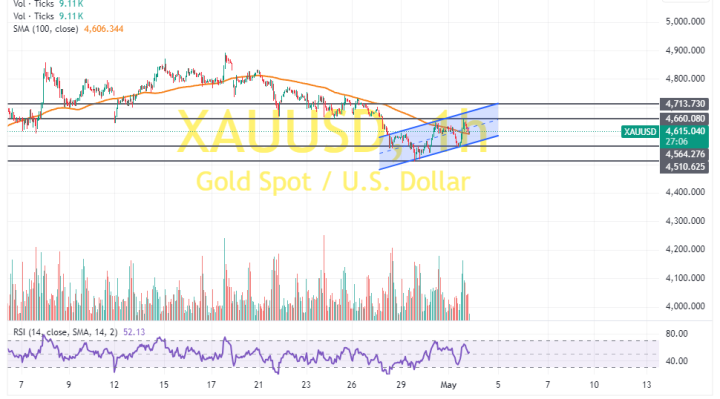
Technically, the gold price trades within an ascending channel formation in the 60-minute chart. However, the 14-hour RSI has recently pulled back to avoid advancing into overbought conditions.
Therefore, the bears will look to extend the latest pullback towards $4,564 or lower to $4,510. On the other hand, the bulls will look to pounce on profits at about $4,660 or higher at $4,713.
Gold Price Technical Analysis (the Daily Chart)
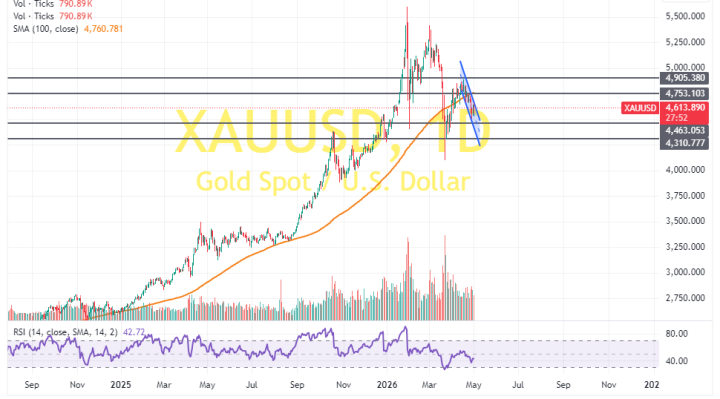
In the daily chart, the price of the yellow metal trades within a descending channel formation. However, the 14-day RSI still has some room left to run before reaching oversold conditions.
Therefore, the bears will look to extend the latest pullback towards $4,463 or lower to $4,310. On the other hand, the bulls will look to pounce on rebounds at about $4,753 or higher at $4,905.