
The price of gold on Friday pulled back off the current multi-month highs of about $1,950 to trade at about $1,927 following the latest round of data. The price of the yellow metal continues to trade within a descending channel formation in the 60-min chart.
The XAU/USD has now declined to trade below the 100-hour moving average line. However, it still seems to have a lot of room left to run before reaching the oversold levels of the 14-hour RSI.
Gold Price Fundamentals Overview

From a fundamental perspective, the yellow metal is trading at the back of a relatively busy period in the US market. Earlier in the week, the preliminary annualised gross domestic product for Q4 beat the expected change of 2.6% with a change of 2.9%. On the other hand, durable goods orders for December outshone the estimated change of 2.5% with a change of 5.6%, while nondefense capital goods orders ex-aircraft were in line with the forecasted change of -0.2%. The initial jobless claims for the period ending January 20 also beat the expected claim count of 205k with a lower tally of 186k.
On Friday, the core personal consumption expenditures price index for December beat the estimated (MoM) change of 0.2% with a change of 0.3%. Personal income for the period came in line with the estimate of 0.2%, while personal spending missed the forecasted change of -0.1% with a change of -0.2%. Elsewhere, the Michigan consumer sentiment index for January beat the estimated reading of 64.6 with a reading of 64.9.
Gold Price Technical Analysis (the 60-min Chart)
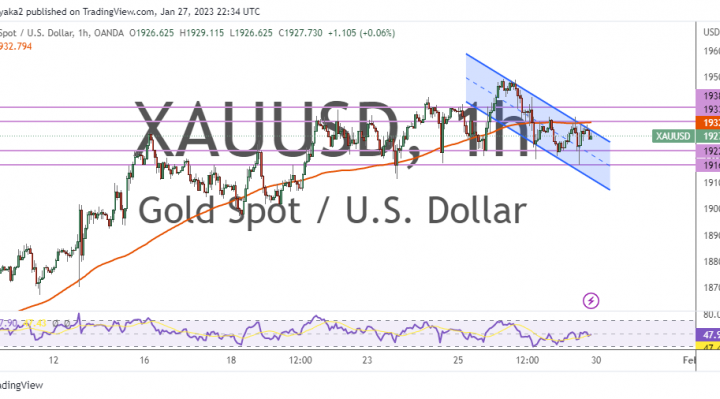
Technically, the price of the yellow metal seems to be trading within a descending channel formation in the 60-min chart. This indicates a significant short-term bullish bias in the market sentiment.
Therefore, the bears will be looking to extend the current declines toward $1,922, or lower to $1,916. On the other hand, the bulls will look to pounce on profits at about $1,933 or higher at $1,938.
Gold Price Technical Analysis (the Daily Chart)
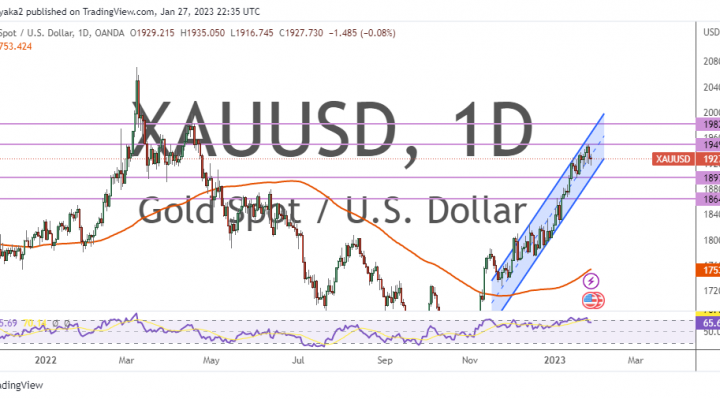
In the daily chart, the XAU/USD seems to be trading within a sharply ascending channel formation. This indicates a strong long-term bullish bias in the market sentiment.
Therefore, the bulls will look to extend the current rally towards $1,949 or higher to $1,982. On the other hand, the bears will be targeting long-term profits at about $1,897 or lower at $1,864.