
On Friday, the gold price pulled back from the current all-time highs of about $3,087 to trade at about $3,078 after the U.S. data. The XAU/USD trades within an ascending channel formation in the 60-minute chart.
The price of the yellow metal has rallied to trade several levels above the 100-hour moving average line. However, it pulled back later to avoid advancing into the overbought levels of the 14-hour RSI.
Gold Price Fundamentals Overview

From a fundamental perspective, the XAU/USD trades during a relatively busy period in the U.S. market. On Friday, the Michigan Consumer Sentiment Index for March fell slightly to 57, down from 57.9 in the previous month, missing the forecast of 57.9. On the other hand, the UoM 5-year consumer inflation expectation increased to 4.1%, up from 3.9, beating the expectation of 3.9%.
Personal income for February beat the forecasted (MoM) change of 0.4% with a change of 0.8%, while personal spending missed 0.5% with a change of 0.4%. On the other hand, the personal consumption expenditures – price index for February matched the (MoM) and (YoY) forecasts of 0.3% and 2.5%, respectively. The core personal consumption expenditures – price index for the period outshone the (MoM) estimate of 0.3% with 0.4%, while the (YoY) equivalent beat 2.7% with 2.8%.
Earlier in the week, the U.S. initial jobless claims for the week ending March 21 edged slightly lower to 224k, down from 225k in the preceding week, beating the forecasted claim count of 225k.
Gold Price Technical Analysis (the 60-min Chart)
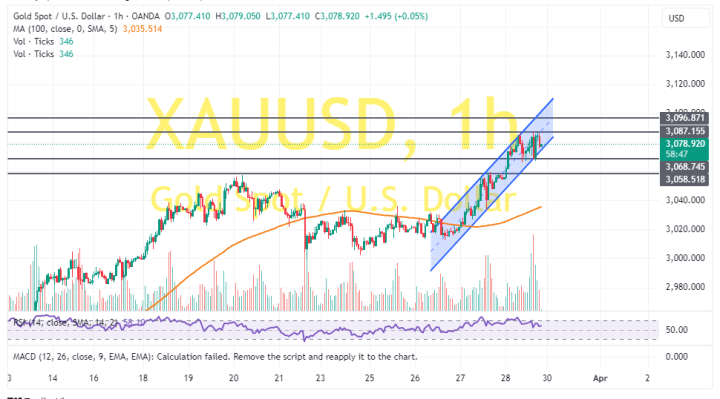
Technically, the price of the yellow metal trades within an ascending channel formation in the 60-minute chart. However, the 14-hour RSI has recently pulled back to avoid rallying into overbought conditions.
Therefore, the bears will look to extend the current pullback towards $3,068 or lower to $3,058. On the other hand, the bulls will look to pounce on profits at about $3,087 or higher at $3,096.
Gold Price Technical Analysis (the Daily Chart)
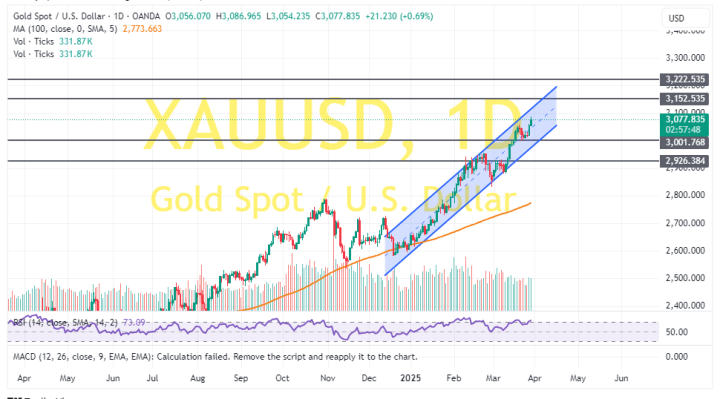
In the daily chart, the gold price also trades within an ascending channel formation. The 14-day RSI has rallied into overbought conditions, supporting a long-term bullish bias.
Therefore, the bulls will look to stretch the current rally towards $3,152 or higher to $3,222. On the other hand, the bears will look to pounce on pullbacks at about $3,001 or lower at $2,926.