
The gold price on Friday pulled back off session highs of about $20,55 to trade at about $2,037 after the latest round of data. The XAU/USD appears to have completed a downward breakout from an ascending channel formation.
The price of the yellow metal has also fallen to trade below the 100-hour moving average line. However, a late rebound on Friday prevented the gold price from falling into the oversold levels of the 14-hour RSI.
Gold Price Fundamentals Overview

From a fundamental perspective, the yellow metal is trading at the back of a relatively busy period in the US market. On Friday, the US unemployment rate for January remained unchanged from December at 3.7%, beating the forecasted rate of 3.8%.
The nonfarm payrolls for the month also beat the estimated job count of 180 with a tally of 353k. On the other hand, the average hourly wage for the period outshone both the (MoM) and (YoY) expectations of 0.3% and 4.1%, respectively with a change of 0.6% and 4.5%. The Michigan Consumer Sentiment Index for January also impressed with a reading of 79 versus a forecasted reading of 78.9.
Earlier in the week, the ISM Manufacturing PMI for January beat the expectation of 47 with a reading of 49.1. The ISM Manufacturing Prices Paid for the period also exceeded the estimate of 49.6 with a reading of 52.6. On the other hand, the initial jobless claims for last week missed the expected claim count of 212k with a significantly higher tally of 224k.
The preliminary nonfarm productivity for Q4 beat the estimated change of 2.5% with a change of 3.2%, while the unit labour costs for the quarter missed 1.7% with 0.5%.
Gold Price Technical Analysis (the 60-min Chart)
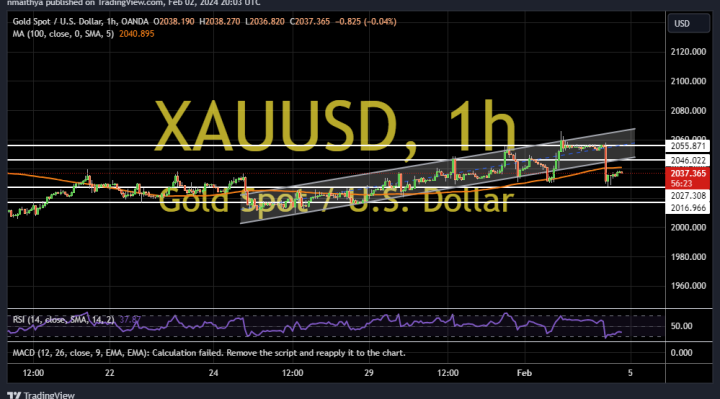
Technically, the XAU/USD appears to have recently completed a downward breakout from an ascending channel formation. However, the 14-hour RSI seems to have bounced back to avoid falling into oversold conditions.
Therefore, the bulls will be targeting extended rebound profits at about $2,046 or higher at $2,055. On the other hand, the bears will look to extend the current declines toward $2,027 or lower to $2,016.
Gold Price Technical Analysis (the Daily Chart)
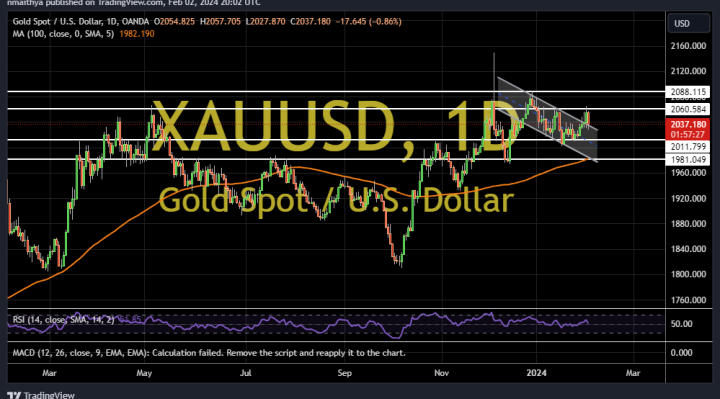
In the daily chart, the price of the yellow metal appears to have recently completed an upward breakout from a descending channel formation. However, the 14-day RSI recently pulled back to avoid rallying into overbought conditions.
Therefore, the bears will target extended pullbacks at about $2,011 or lower at $1,981. On the other hand, the bulls will look to ride the current gains toward $2,060 or higher to $2,088.