
The gold price on Friday pulled back off the session highs of about $2,172 to trade at about $2,158 after the latest US data. The XAU/USD appears to be trading within a sideways channel formation in the 60-minute chart.
The gold price has now pulled back to trade a few levels below the 100-hour moving average line. As a result, the yellow metal appears to be on the verge of entering the oversold levels of the 14-hour RSI.
Gold Price Fundamentals Overview

From a fundamental perspective, the XAU/USD is trading at the back of a relatively busy period in the US market. On Friday, the preliminary UoM 5-year consumer inflation expectations for March remained unchanged at 2.9%. The preliminary Michigan Consumer Sentiment Index for March missed the expected reading of 76.9 with a reading of 76.5.
On the other hand, industrial production for February outperformed the expected (MoM) change of 0% with a change of 0.1%, up from -0.5% in the preceding period. The NY Empire State Manufacturing Index for March missed -7 with a reading of -20.9.
Earlier in the week, US retail sales for February missed the expectation of 0.8% with a change of 0.6% (MoM). The retail sales ex-autos also fell short of 0.5% with a change of 0.3%, while the initial jobless claims for last week beat 218k with a tally of 209k.
Elsewhere, the producer price index for February outshone the estimate of 0.3% with a change of 0.6% (MoM), while the (YoY) equivalent beat 1.1% with a change of 1.6%. The PPI ex-food and energy also exceeded expectations of 0.2% (MoM) and 1.9% (YoY) with changes of 0.3% and 2%, respectively.
Gold Price Technical Analysis (the 60-min Chart)
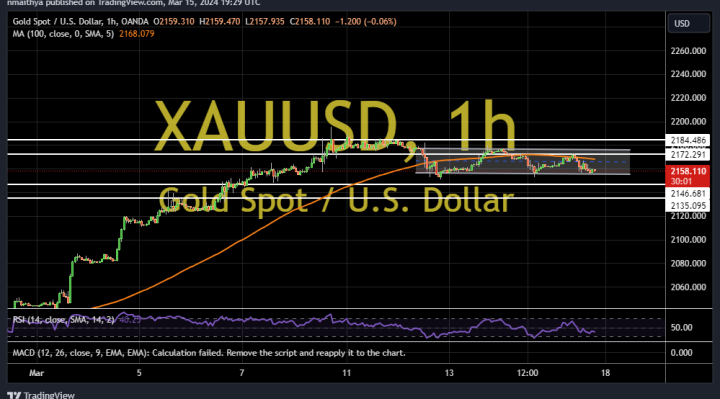
Technically, the XAU/USD appears to be trading within a sideways channel formation in the 60-minute chart. However, the 14-hour RSI seems to be moving closer to the oversold conditions, indicating a shift towards the bears.
Therefore, the bears will be targeting extended pullback profits at about $2,146 or lower at $2,135. On the other hand, the bulls will look to pounce on rebounds at about $2,172 or higher at $2,184.
Gold Price Technical Analysis (the Daily Chart)
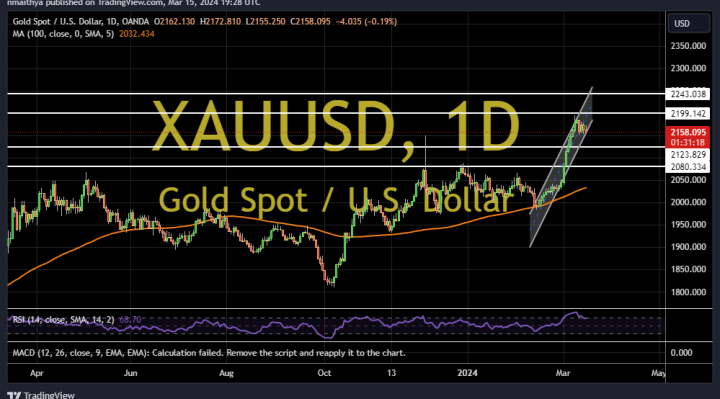
In the daily chart, the yellow metal appears to be trading within a sharply ascending channel formation. As a result, the 14-day RSI rallied into overbought conditions on Friday before attempting a pullback.
Therefore, the bears will be targeting potential pullback profits at about $2,123 or lower at $2,080. On the other hand, the bulls will be looking to extend the current rally towards $2,199 or higher to $2,243.