
On Friday, the gold price pulled back from the session highs of about 2,666 to trade at about $2,642. The XAU/USD also completed a downward breakout from an ascending channel formation.
The price of the yellow metal has now fallen closer to the 100-hour moving average line in the 60-minute chart. As a result, the gold price is on the verge of entering the oversold levels of the 14-hour RSI.
Gold Price Fundamentals Overview

From a fundamental perspective, the XAU/USD trades during a relatively busy period in the U.S. market. On Friday, the U.S. ISM Manufacturing PMI for December outperformed the expectation of 48.4 with a reading of 49.3. The ISM Manufacturing Prices Paid for the period also outshone the forecast of 51.7 with 52.5, while the ISM Manufacturing Employment Index missed 48 with a reading of 45.3.
On Thursday, the U.S. initial jobless claims for last week came in lower than expected with 211k versus a forecasted claim count of 220k, down from the preceding week’s equivalent of 222k. The continuing claims for the week ending December 20 also beat the estimate of 1.89 million with a tally of 1.844 million, down from 1.896 million.
Elsewhere, the construction spending for November fell short of the forecasted (MoM) change of 0.3% with a change of 0%, while the S&P Global Manufacturing PMI for December came in stronger than expected with 49.4 versus a forecast of 48.3.
Earlier in the week, The Chicago Purchasing Managers’ Index for December missed the expectation of 42.5 with a reading of 36.9, while the pending home sales for November beat the (MoM) forecast of 0.7% with a change of 2.2%.
Gold Price Technical Analysis (the 60-min Chart)
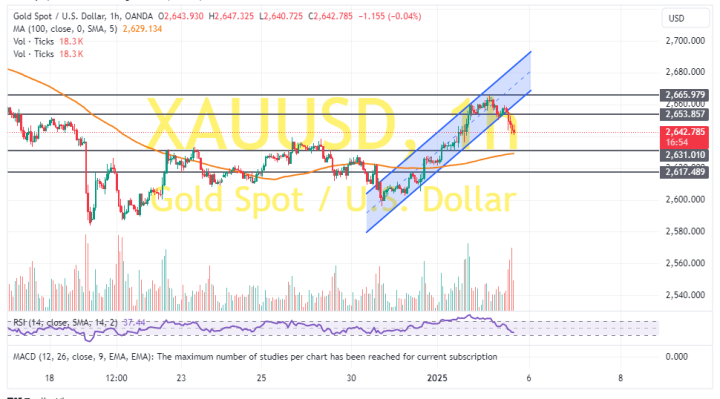
Technically, the XAU/USD has recently completed a downward breakout from an ascending channel formation. The 14-hour RSI has also pulled back to recover from overbought conditions.
Therefore, the bears will look to extend the current pullback towards $2,631 or lower to $2,617. On the other hand, the bulls will look to pounce on rebounds at about $2,653 or higher at $2,665.
Gold Price Technical Analysis (the Daily Chart)
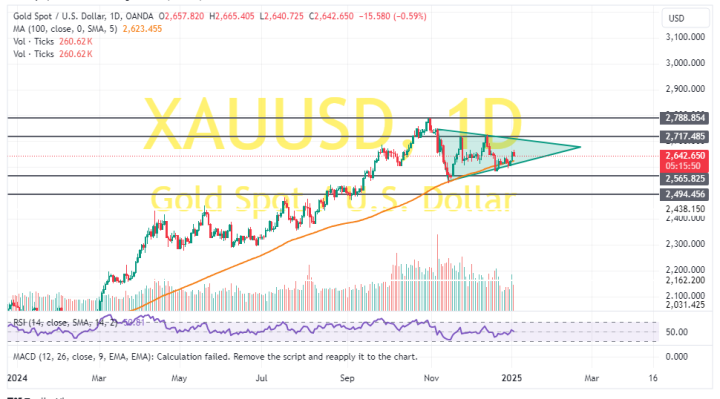
In the daily chart, the yellow metal continues to trade within a consolidative triangle formation. The 14-day RSI has recently bounced back to moves towards the overbought conditions.
Therefore, the bulls will look to stretch the current rebound towards $2,717 or higher to $2,788. On the other hand, the bears will look to pounce on pullbacks at about $2,565 or lower at $2,494.