
The price of gold on Tuesday pulled back off the current weekly highs of about $1,845 to trade at around $1,830. It recovered later to settle at $1,840. The yellow metal continues to trade within a descending channel formation in the 60-min chart. This comes after finding strong resistance from the trendline above.
Gold is now pinned just off the 100-hour SMA line while the 200-hour SMA is a few levels higher. The price of the yellow metal continues to oscillate close to overbought levels of the 14-hour RSI.
Gold Price Fundamentals Overview

From a fundamental perspective, gold is trading at the back of a relatively busy period in the global financial markets. In China, gross domestic product for Q4 missed the expected (QoQ) growth of 3.2% with a growth of 2.6%. Retail sales for December also missed the (YoY) expectation of 5.5% with a change of 4.6%. Annualized GDP for Q4 beat the expected annual growth of 6.1% with a growth of 6.5%.
In Germany, the harmonized index of consumer prices for December matched the (YoY) expectation of -0.7%. On the other hand, ZEW surveys’ current situation and economic sentiments outperformed expectations. In Japan, industrial production for November missed the (YoY) expectation of -3.4% with -3.9%.
In the US, Treasury SEC nominee Janet Yellen made her speech ahead of President-elect Joe Biden’s inauguration on Wednesday. Biden’s speech is expected to have a significant impact on the market.
Gold Price Technical Analysis (the 60-min Chart)
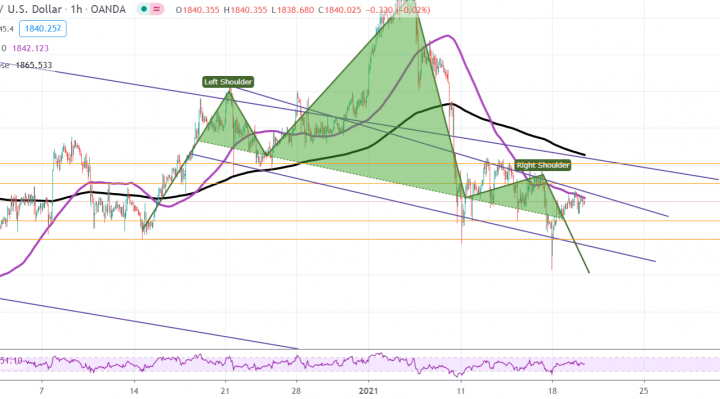
Technically, the gold price appears to be trading within a gently descending channel formation in the 60-min chart. This indicates a significant short-term bearish bias in the market sentiment.
The bears will be looking to extend Tuesday’s pullback towards $1,829 or lower to $1,819. On the other hand, the bears will look to pounce on rebound profits at around $1,850 or higher at $1,860.
Gold Price Technical Analysis (the Daily Chart)
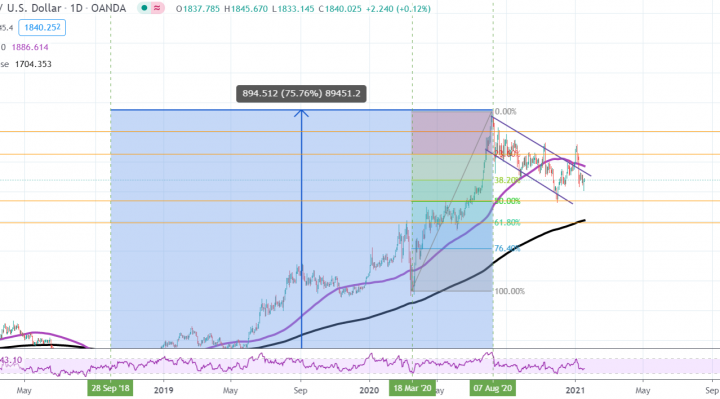
In the daily chart, the yellow metal appears to be trading within a descending channel formation. This indicates a long-term bearish bias in the market sentiment. Gold is now pinned to the 38.20% fib level on the way down. It looks closer to reaching oversold levels of the 14-day RSI.
The bears will look to extend the current declining trend towards 50% and 61.80% fib levels at $1,769 and $1,694, respectively. On the other hand, the bulls will target long-term profits at around 23.605 fib level at $1,927 or higher at $2,002.