
The price of gold on Friday rallied to trade at around $1,930 before pulling back towards the $1,900 level late on. The gold price continues to oscillate within a consolidative triangle formation in the 60-min chart. It is characterized by a flat top and a rising base, which indicates a slight bullish bias.
The yellow metal has now fallen back below the 100-hour and the 200-hour SMA lines. A late attempted rebound prevented it from crossing to the oversold territory of the 14-hour RSI.
Gold Price Fundamentals Overview

From a fundamental perspective, the yellow metal is trading at the back of a relatively busy period in the US market. The US earnings season is gearing towards the climax. Several major banks have already announced results, while big techs are in line next. This could reduce the level of trading activity directed towards safe-haven assets like gold with more investors investing in the earnings season. This could explain the lack of significant movement in the price of gold in recent trading sessions.
Based on the latest US economic data, the preliminary US Markit Manufacturing PMI for October missed the expectation of 53.4 with 53.3. The Services PMI outperformed 54.6 with 56 while the PMI composite improved to 55.5 up from 54.3. On Thursday, the US initial jobless claims for the week ending Oct. 17 beat the expectation of 840k with 787k while continuing claims for the [preceding week outshone 9.5M with 8.373M.
Gold Price Technical Analysis (the 60-min Chart)
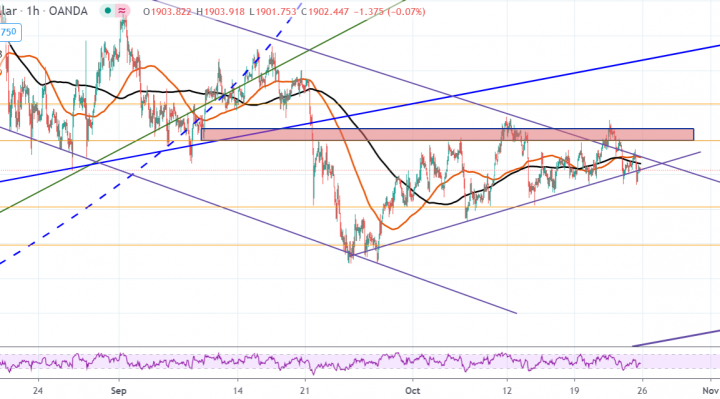
Technically, the XAU/USD appears to be trading within a slightly ascending triangle formation in the 60-min chart. This indicates a slight short-term bullish bias in the market sentiment. The consolidative pattern formation could result in a temporary breakout.
The bulls will be looking for a potential upward breakout by targeting profits at around $1,919 or higher at $1,940. On the other hand, the bears will look to pounce for short-term profits at around $1,881 or lower at $1,859.
Gold Price Technical Analysis (the Daily Chart)
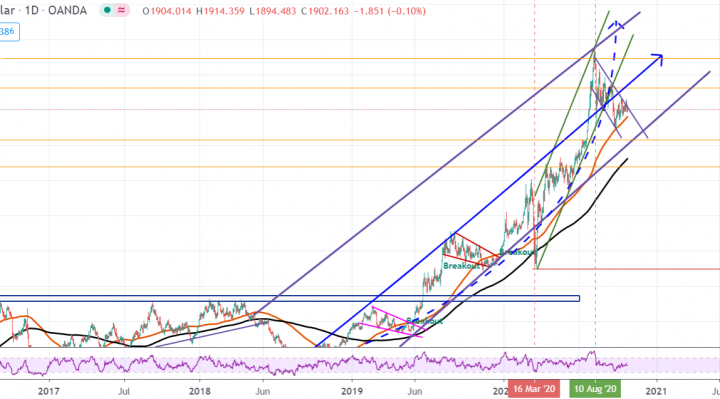
In the daily chart, the price of gold appears to be trading within an ascending channel. This indicates a strong long-term bullish bias in the market sentiment. The price of the yellow metal is far from crossing into the overbought zone of the 14-day RSI. The current trend could continue through next month.
The bulls will look to retain the long-term control of the pair by targeting profits at around $1,962 or higher at $2,046. On the other hand, the bears will target long-term reversal profits at around $1,815 or lower at $1,738.