
The gold price on Friday pulled back from the trendline resistance at $1,931 to trade at about $1,926. The price of the yellow metal appears to be nearing a breakout after the latest pullback.
The gold price continues to trade several levels above the 100-hour moving average line in the 60-min chart. Friday’s pullback prevented the XAU/USD from ascending into the overbought levels of the 14-hour RSI.
Gold Price Fundamentals Overview

From a fundamental perspective, the price of yellow metal is trading at the back of a relatively busy period in the US market. On Friday, the existing home sales for December outperformed the (MoM) expectation of 1.396 million with a higher tally of 1.402 million.
On the other hand, the existing home sales change for the period outshone the forecasted change of -5.4% with a change of -1.5%. On Thursday, the building permits for December missed the forecasted tally of 1.37 million with a tally of 1.33 million while housing starts for the period outshone the estimate of 1.359 million with a tally of 1.382 million.
Elsewhere, the initial and continuing jobless claims for the week ending January 13 and the preceding week beat the expectations of 214k and 1.66 million respectively with 190k and 1.647 million. The Philadelphia Fed Manufacturing Survey for January also outshone the estimated reading of -11 with a reading of -8.9. Earlier in the week, retail sales and the retail sales control group missed the estimates of -0.8% and -0.2%, respectively with -1.1% and -0.7%.
Gold Price Technical Analysis (the Daily Chart)
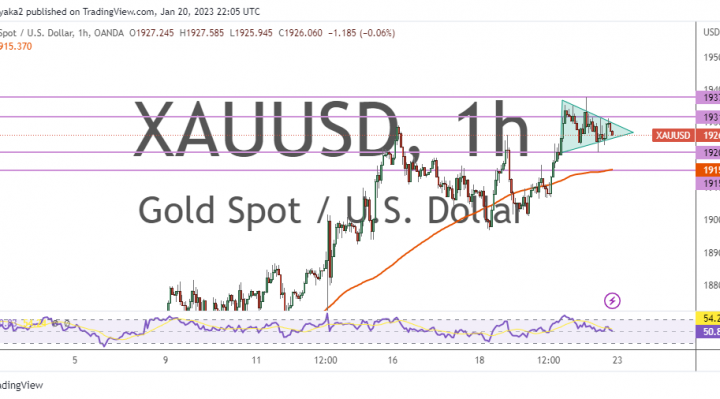
Technically, the gold price appears to be trading within a consolidative triangle formation in the 60-min chart. This indicates a lack of clear directional bias in the market sentiment.
Therefore, the bears will be targeting potential downward breakouts at about $1,920 or lower at $1,915. On the other hand, the bulls will look to pounce on profits at about $1,931 or higher at $1,937.
Gold Price Technical Analysis (the Daily Chart)
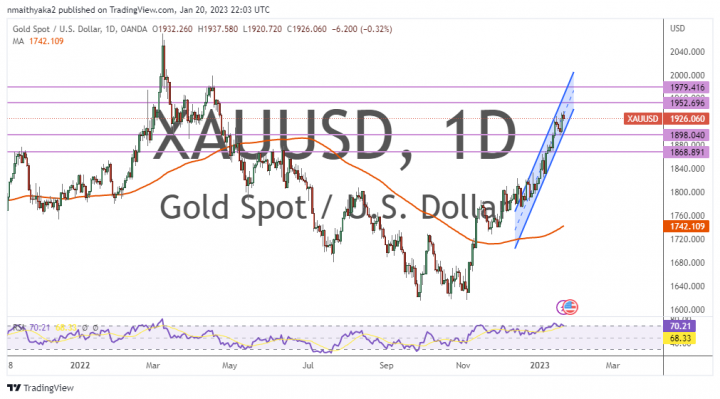
In the daily chart, the gold price appears to be trading within a sharply ascending channel formation. This indicates a strong long-term bullish bias in the market sentiment.
Therefore, the bulls will be looking to stretch the current gains toward $1,952 or higher to $1,979. On the other hand, the bears will be targeting long-term profits at about $1,898 or lower at $1,868.