
HD Long-term outlook
Home Depot is one of the companies which expected to report strong growth on 21st February 2017. The company is moving up joining the upward trend in the housing market. Unfortunately, HD also projected to suffer from the new administration implementation by President Trump.
The company will report fiscal quarter ending Jan 2017 before market open with estimate eps of $1.33 according to Zacks Investment Research. Reported eps same period last year was $1.17. Revenue consensus at $21.78 billion.

Click here to see HD December analysis
New Month
Monthly chart
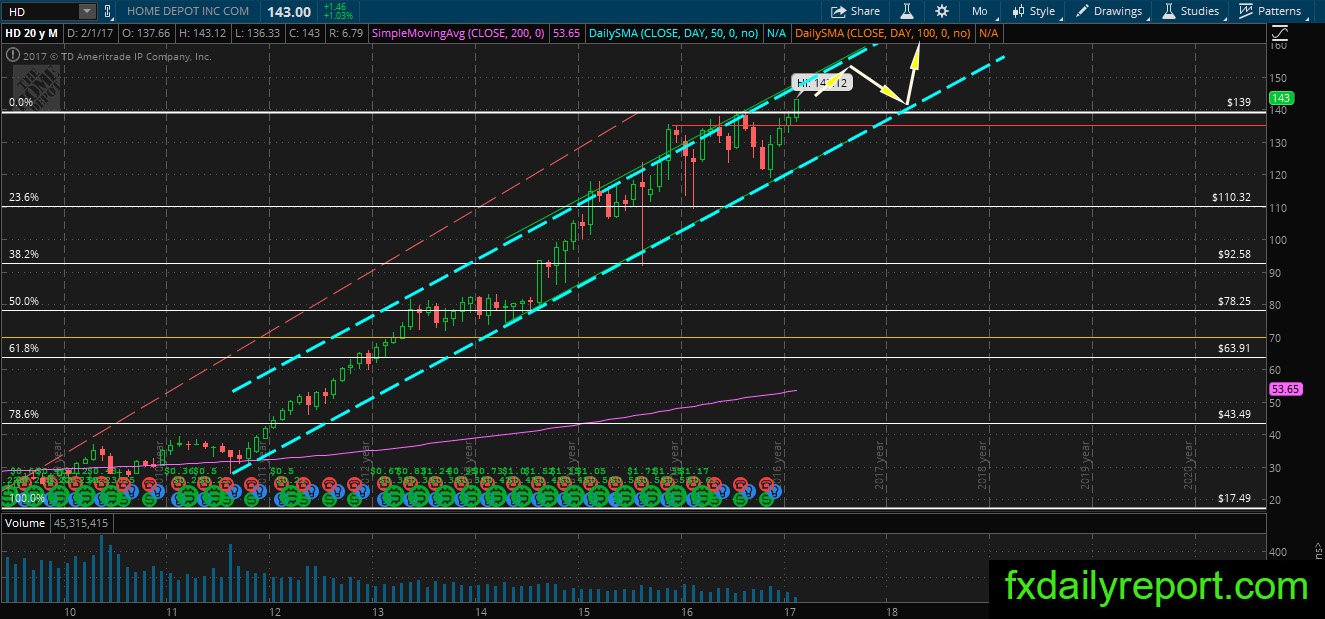
December bounce in HD shares put the stock up toward its upper channel. Strong momentum maintained and it is possible for the shares to continue upward. On the upside, $150 handle will become a big barrier to overcome by the shares, and bull traders might be wary of reversal at the resistance.
Weekly chart
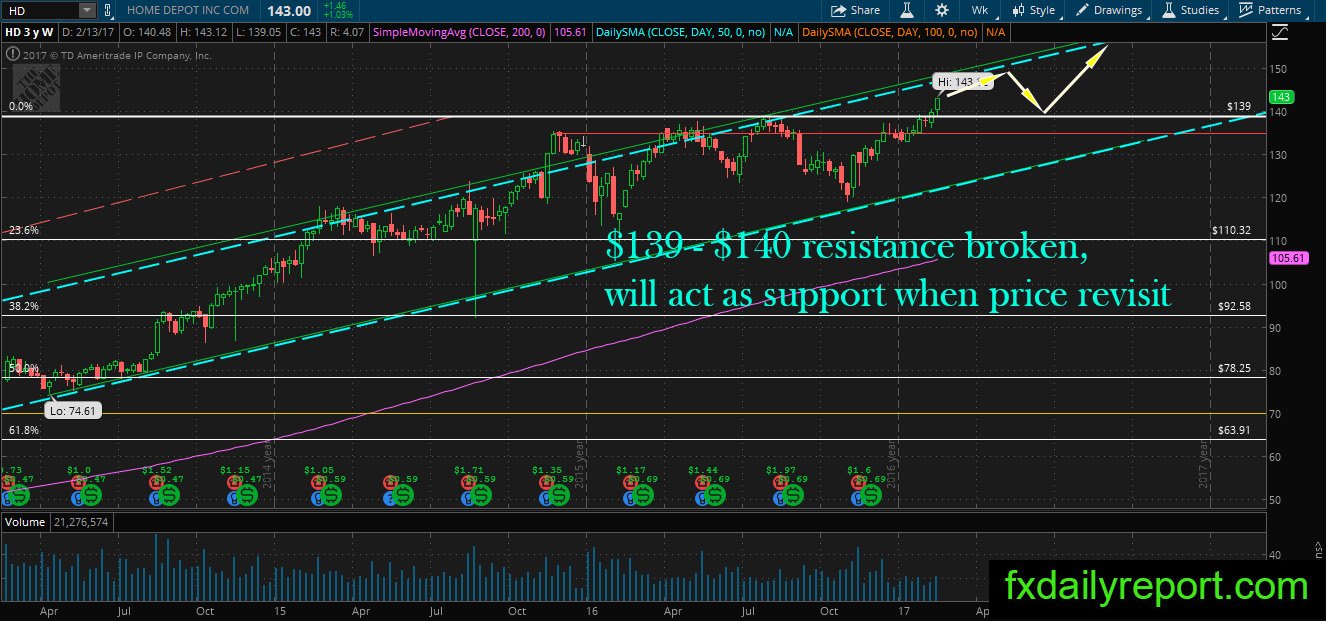
The $139 – $140 resistance play a major part in limiting all upward movement in 2016. It is finally broken on the weekly chart. The price might continue without any test on the broken resistance, but if it manages to move lower and test it, the bull trader will have a chance to place long position.
Daily chart

Bullish trend in HD has a strong momentum, and previous day close show a new record high which indicates more strength before the price reverses its course of movement. Similar to its weekly and monthly chart, $139 – $140 will act as resistance while the upside target located at $150.
Trade plan
Bullish position chance when the price corrected near its broken resistance at $139 – $140.
Bearish position needs to wait until the price reached $150 or upper part of the channel. Wait until bearish pattern formed before entering any position.