
HD Long-term outlook
2019 is a bullish year for Home Depot (NYSE: HD). The share prices raised from $169.71 to as high as $239.31 before corrected lower and closed at $218.38. It is an impressive 28.7% gain for the year. At the start of 2020, HD continues its upward movement and ready to close January on the positive note.
It is possible HD will continue its upward movement in the coming months and create further fresh all-time high. There is tax-cut planned for this year by President Donald Trump. It might give raise to HD share prices.
New Month
Monthly chart

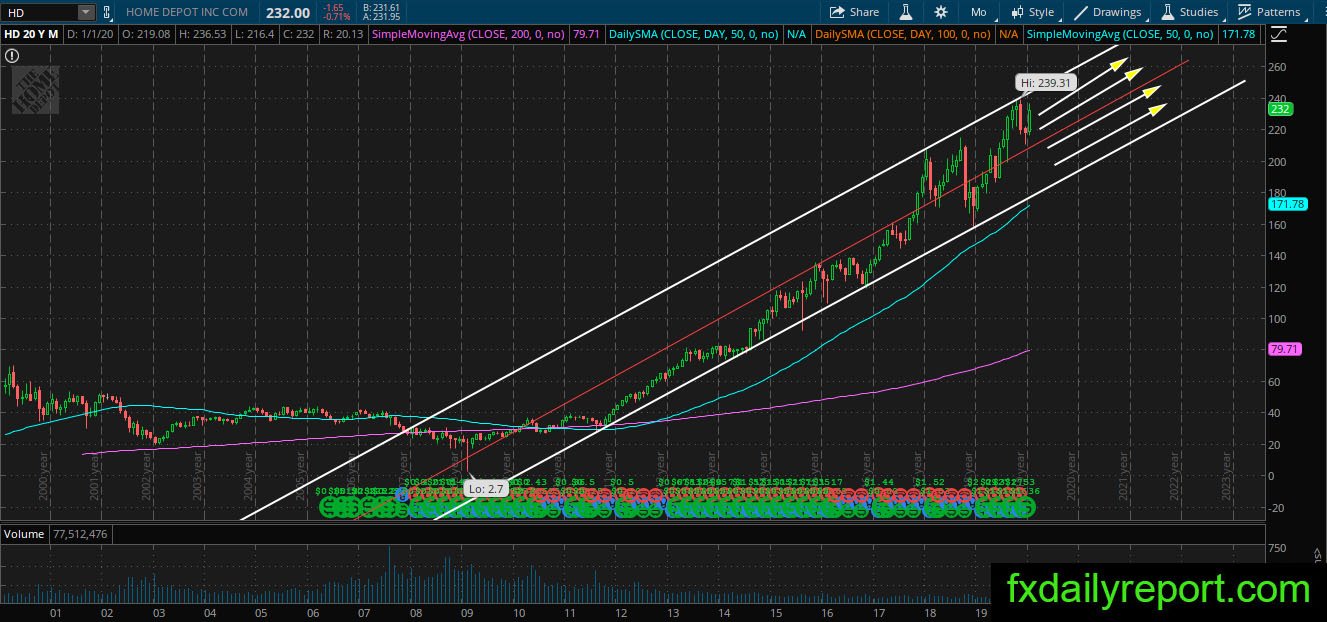
HD share prices extremely bullish on the monthly chart inside the bullish channel. The share prices expected to continue its bullish trend inside the channel and traders could make use a bearish correction to add long positions. Short positions could be taken near the top of channel but not suggested as the overall trend is bullish.
Weekly chart
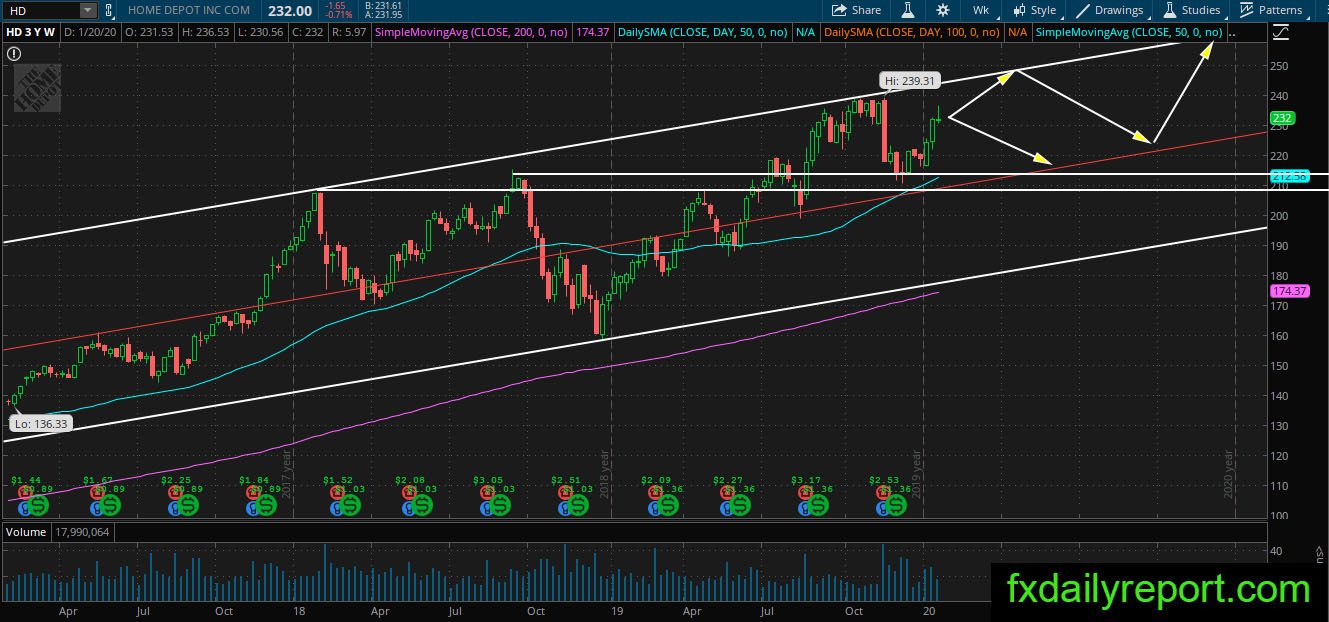
Similar to the monthly chart, HD on the weekly chart also show strong bullish pressure. The share prices currently move higher and target the top of the channel. If a bearish correction happen then traders could aim for long positions between $207.00 – $215.00.
Daily chart
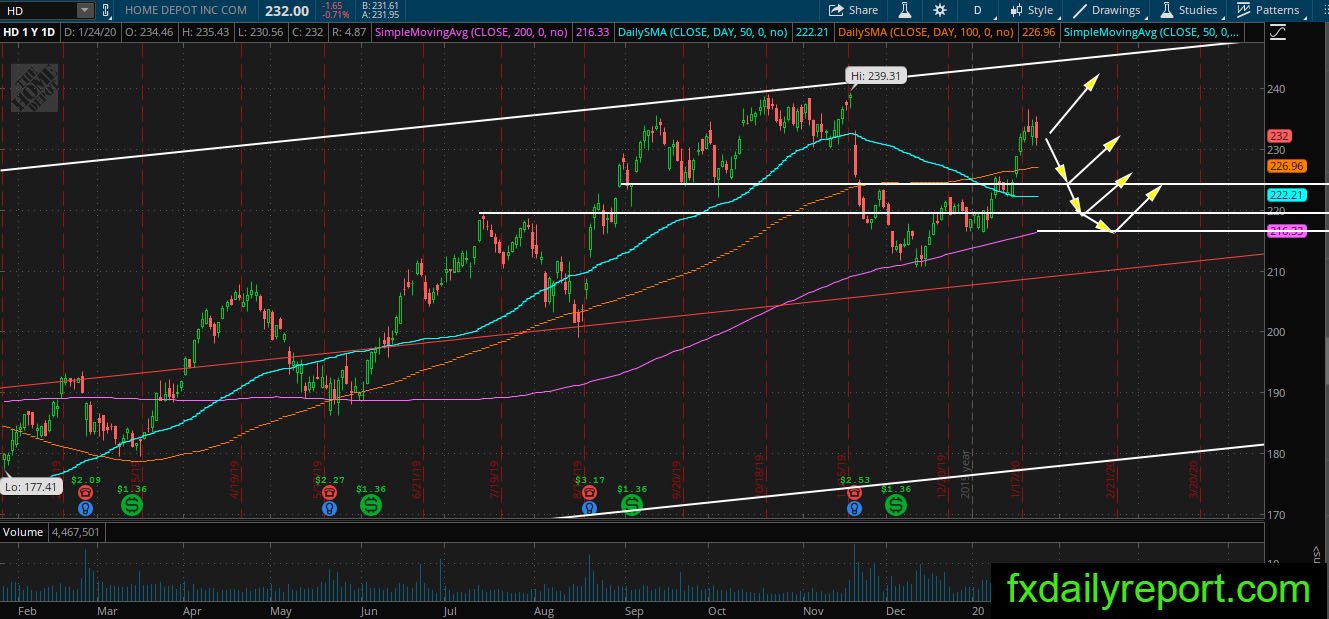
We are aiming to enter long positions which mean if HD continue its upward movement then nothing to do. If HD move lower then traders could observe the daily SMA 50, the level around $220.00 – $225.00, SMA 200 and the red trendline for long positions.
Trade plan
No bearish setup under the current strong bullish environment. Traders will wait for a bearish correction to enter long positions. Similar to the strategies on the daily chart, traders will wait until the share prices reach the daily SMA 50, the level around $220.00 – $225.00, SMA 200 and the red trendline for long positions.