
HD Long-term outlook
Home Depot continue its bullish journey in February after the company reported better than expected earnings. The share hit a record high at $146.33 and continue performing in March. Without any bad news or weak data, the shares of HD could continue higher.
Reviewing other retailers such as Macy’s (M), Target (TGT), and J.C Penney (JCP) which met with a gloomy outlook, Home Depot has done a good job on following the housing boom. Under President Trump policies, there should be room for infrastructure and housing market which will provide more opportunities for HD. Despite the disadvantage from border tax and other taxes, HD might continue to perform.

Click here to see HD February analysis
New Month
Monthly chart
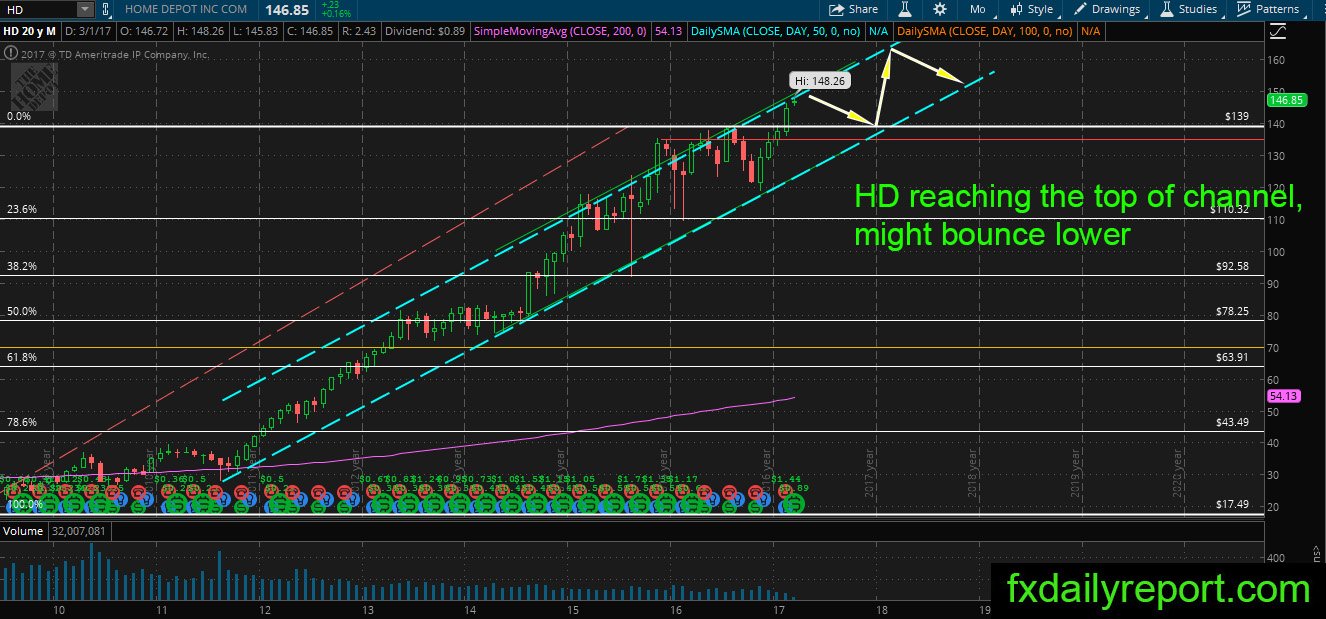
The monthly chart of HD shows the share price hit a new record high and near the top of the channel. The price might reverse its course and start correction when bearish candlestick printed. Meanwhile, traders could wait and see until HD form a new technical pattern.
Weekly chart
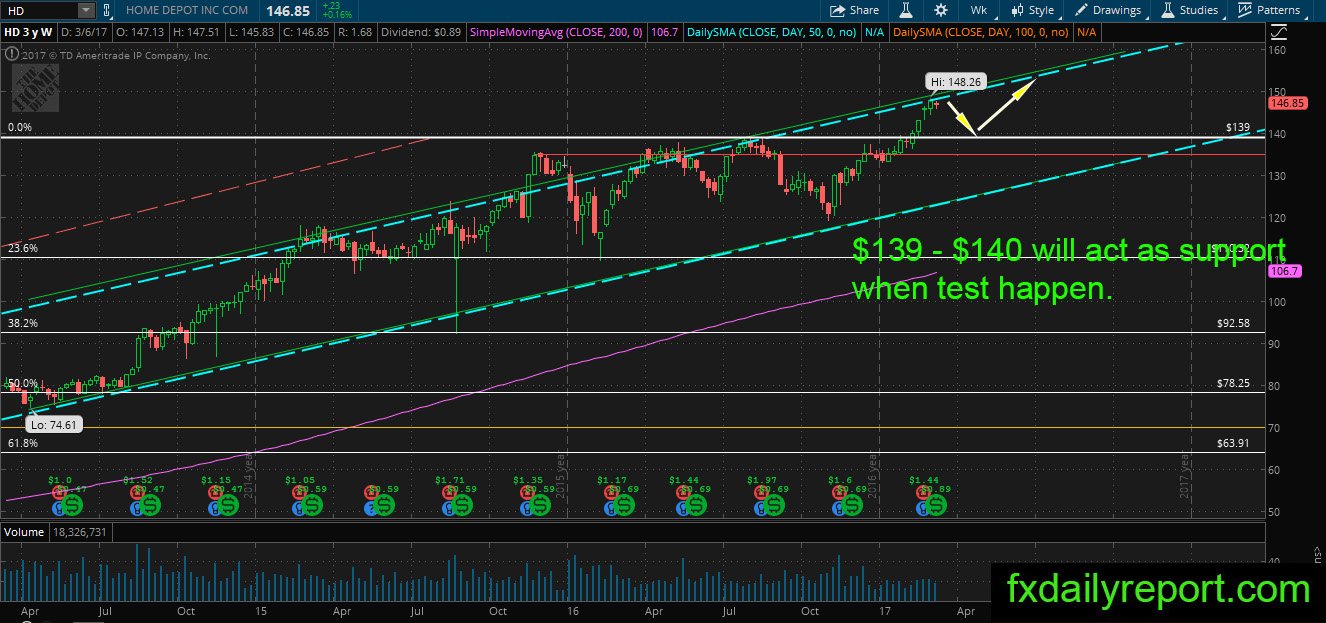
The weekly chart of HD printed harami pattern which shows indecision at the top. There is no confirmation yet where the price will head to. If the price close below $144.47, it might start correction toward $139 – $140. Otherwise, the price might turn higher and print new record high.
Daily chart

Although HD is near psychological level $150, there is no reason yet for traders to short the share price. Traders should observe how price reacted at the top of channel or $150 resistance. If there is bearish candlestick followed by a sharp turn lower, it might be the best sign the trend will reverse.
Trade plan
Bullish position needs to wait until re-test of $139 – $140 support area happen.
The bearish position could be taken when $150 or top of channel tested and produced bearish pattern.