
HD Long-term outlook
Home Depot (NYSE: HD) share prices gained 11.28% for the year from $190.21 to current level at $211.68. But if we calculate the rally from this year low at $170.42, the share prices have gained 24.21% which is an impressive number. The strong quarterly number and increase in home building environment helped HD to stay on the bullish track.
There is nothing to stop the share prices from moving further higher. But, intensifying trade war situation on the global market could become the major reason for traders and investors to stop holding shares.
New Month
Monthly chart


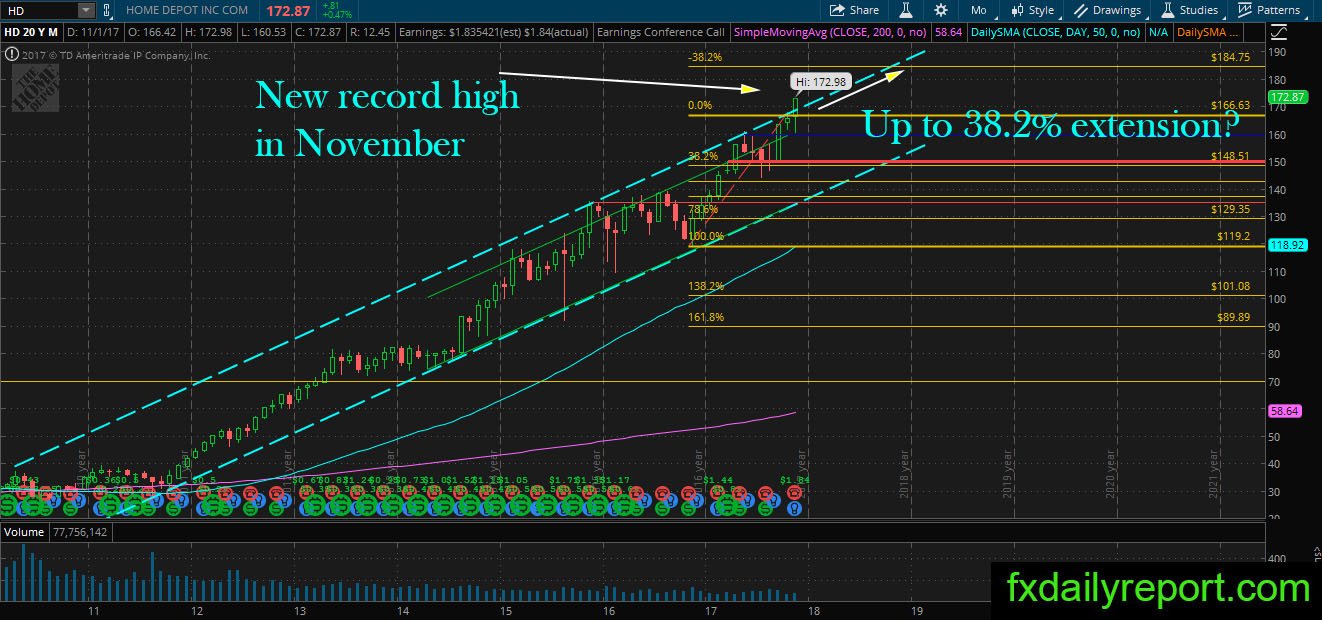
HD share prices performance moving exceptionally and break above the bullish channel shown on the monthly chart. Previously, after the breakout, the bull use the breakout point as a base level to bounce and continue further higher. We think the share prices could continue higher without any change in the situation. 23.6% extension level at $222.56 will become the next upward target.
Weekly chart
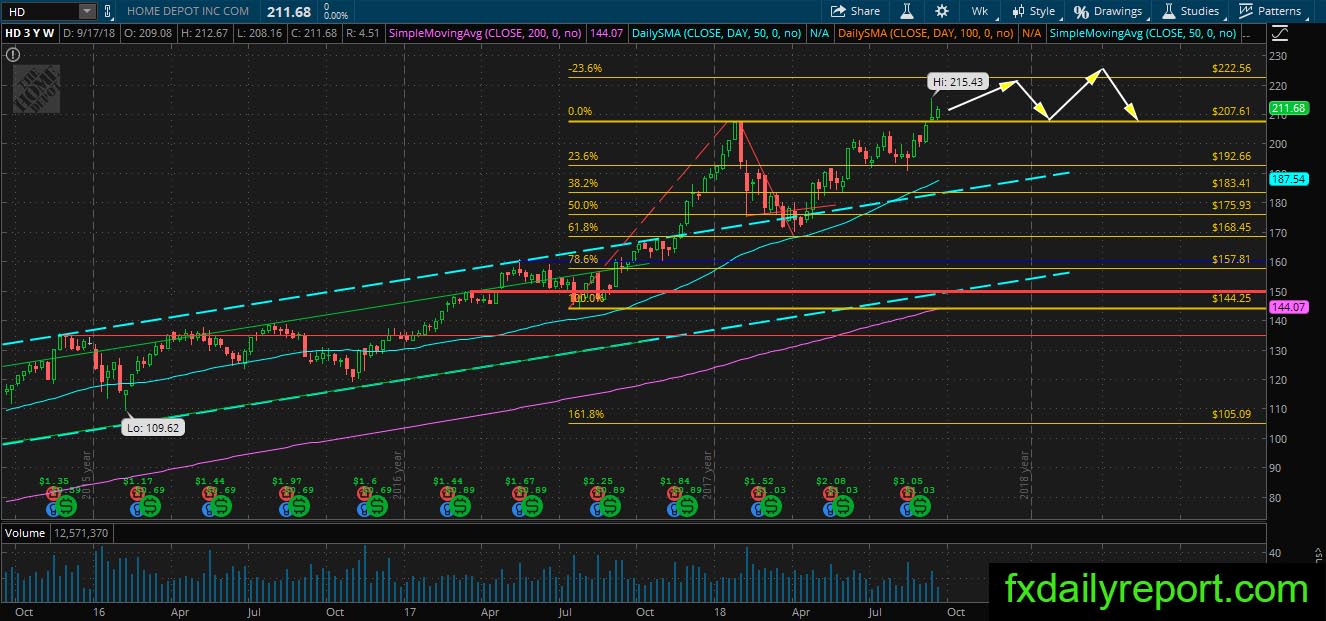
The same view as the monthly chart, HD weekly chart also suggest further upside toward the $222.56 target. When the target reached, we might see some ranging movement between $207.61 – $222.56 until next direction settled.
Daily chart

The recent breakout above January ’18 high brought HD to fresh high at $215.43 before turning down to test the breakout level. It seems the bull manages to hold the selling and looking to add more gain. There is no reason to take a short position yet.
Trade plan
The bullish position is best taken when pullback happens, the strongest level to watch is $200 and $207.61.
No bearish setup suggested yet as HD trend is extremely bullish. Both fundamental and technical analysis pointed to the same side and it is better to wait until both sides pointed to the bearish side.