
IBM Long-term outlook
IBM jumped in October after the company reported the strong third quarter result. The company reported earnings per share of $3.30 vs. $3.28 analyst expectation. Revenue comes out at $19.15 billion vs. $18.6 billion. Overall, the number is good, but IBM has yet to stop its revenue decline which continues for 22nd quarters in a row.
There is interesting news which traders need to consider on IBM. Last quarter, Warren Buffet sold the third quarter of its IBM shares. The selling brought down Buffet’s ownership from 81 million shares to roughly 54 million shares. It is not good news for IBM as well known investors who believe in “buy and hold forever” method start selling the company shares.

What will happen to IBM in the future? It will depend on the company ability to boost its revenue and operating profits.
Click here to see IBM September analysis
New Month
Monthly chart
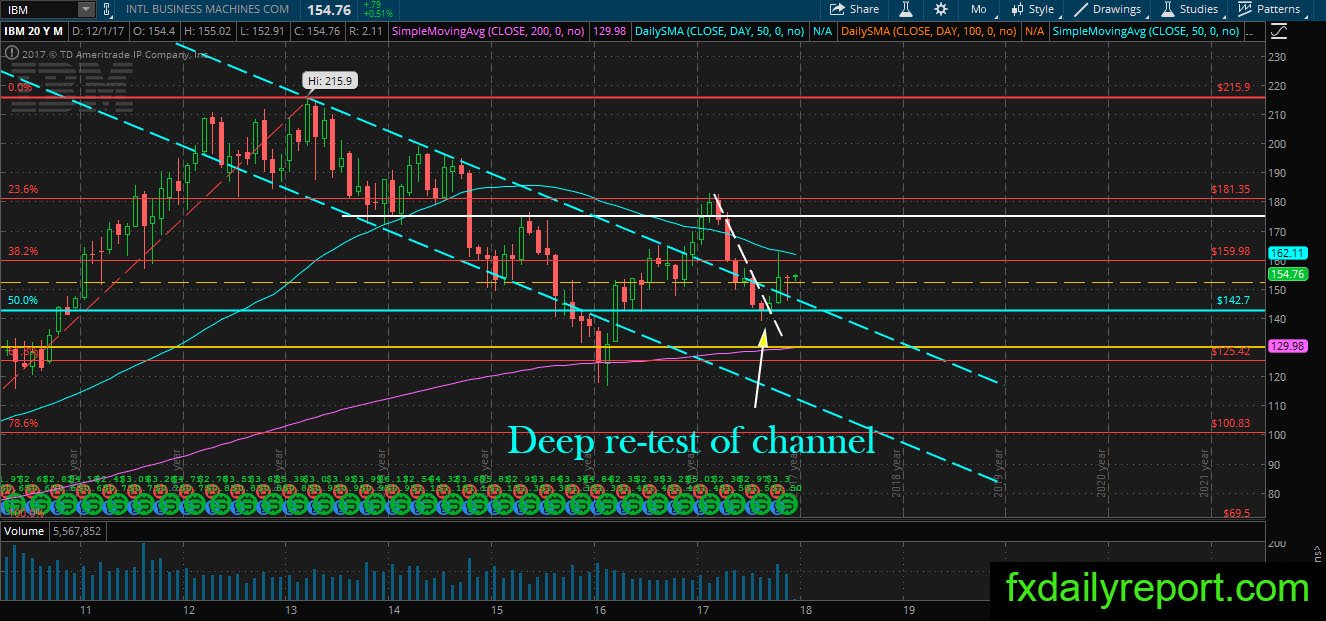
A splendid bounce from the 50% Fibonacci Retracement level brought IBM out of its bearish channel retest. The share prices hopeful to start a bullish trend, but cautiously pessimistic as major trend stay bearish. IBM needs a close above monthly SMA 50 and $183.00 to surpass previous high.
Weekly chart
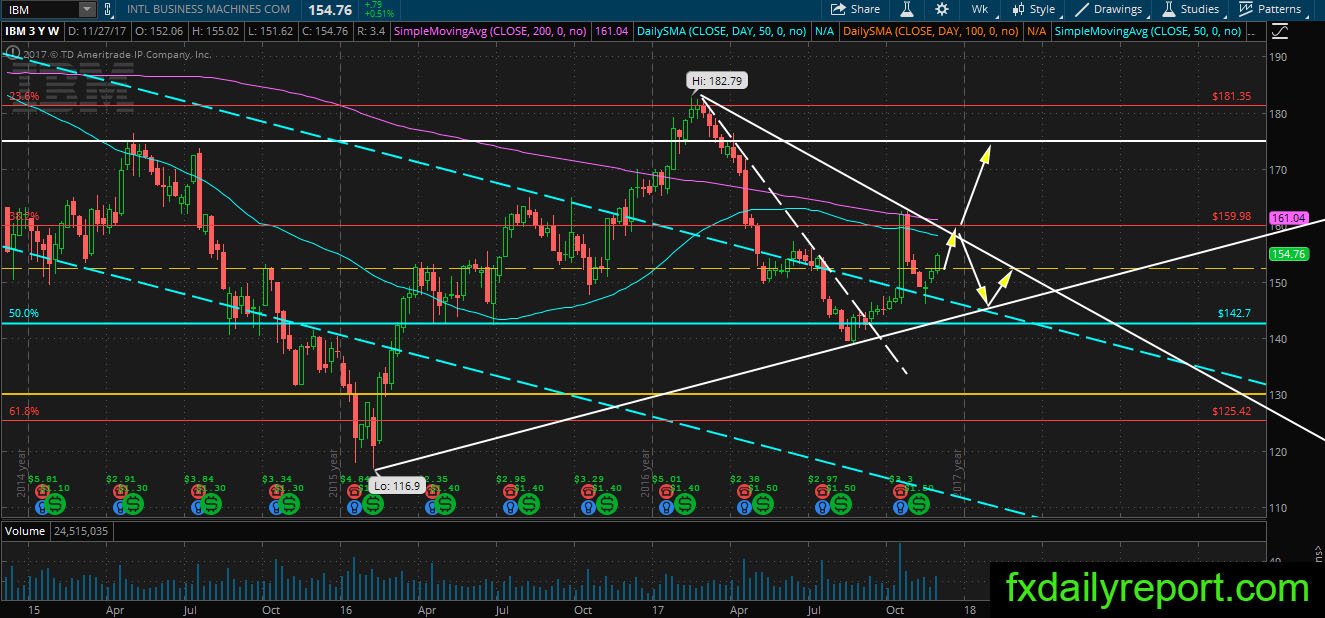
On the weekly chart, we could find IBM fell below WSMA 200 and bounced down after re-test. The outlook is not encouraging for the bull. However, there is the possibility the share prices will make another retest. On the downside, there is trendline support and level around $150.00 which will hold the price from sliding down.
Daily chart
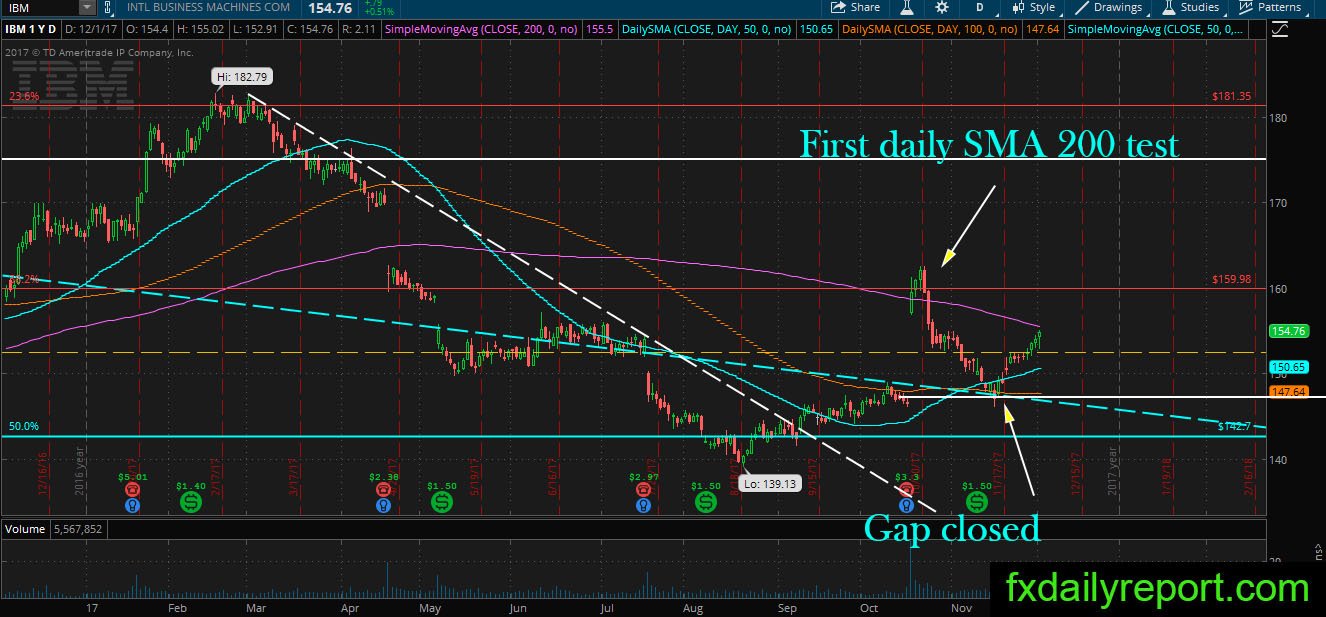
What happens on IBM daily chart is worth to note. The share prices gapped up after the strong earnings report. It managed to move above daily SMA 200 but rejected lower after the fourth day. The bear returned and pushed the price down to close the earnings gap. Since the closure of gap, IBM selling pressure recedes, and the price is currently testing the SMA 200 once again.
It is interesting to see the market reaction to the second test. Will the bull secure the control and break higher to start a new bullish trend? Alternatively, will the bear continue to hold the upper hand and bounce the price down?
Trade plan
Bullish position needs to wait until the share prices close above daily SMA 200 and make strong bounce on re-test.
The bearish position could be taken at daily SMA 200 when bearish candlestick pattern formed.